–Р–љ–∞–ї–Є–Ј –њ–Њ –Ї–Њ–ї–Є—З–µ—Б—В–≤—Г –љ–∞–ї–Њ–ґ–µ–љ–љ—Л—Е —И—В—А–∞—Д–Њ–≤
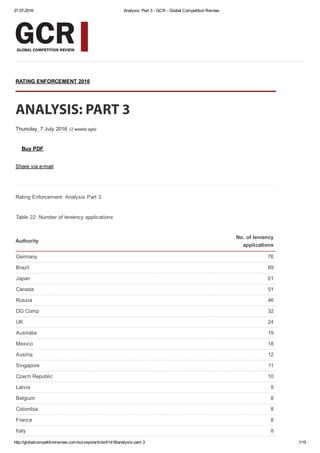
- 1. 27.07.2016 Analysis: Part 3 ­ GCR ­ Global Competition Review http://globalcompetitionreview.com/surveys/article/41418/analysis­part­3 1/15 RATING ENFORCEMENT 2016 ANALYSIS: PART 3 Thursday, 7 July 2016 (2 weeks ago) Buy PDF Share via e­mail Rating Enforcement: Analysis Part 3 Table 22: Number of leniency applications Authority No. of leniency applications Germany 76 Brazil 69 Japan 61 Canada 51 Russia 46 DG Comp 32 UK 24 Australia 19 Mexico 18 Austria 12 Singapore 11 Czech Republic 10 Latvia 9 Belgium 8 Colombia 8 France 8 Italy 8
- 2. 27.07.2016 Analysis:¬†Part¬†3¬†¬≠¬†GCR¬†¬≠¬†Global¬†Competition¬†Review http://globalcompetitionreview.com/surveys/article/41418/analysis¬≠part¬≠3 2/15 Romania 6 Finland 5 Sweden 5 New¬†Zealand 4 India 3 Norway 3 Portugal 3 Chile 2 Poland 2 Turkey 1 Israel 0 Lithuania 0 Pakistan 0 (Click¬†for¬†larger¬†image) Table¬†23:¬†Cartel¬†fines Authority Cartel¬†fines¬†(вВђ¬†million)
- 3. 27.07.2016 Analysis: Part 3 ­ GCR ­ Global Competition Review http://globalcompetitionreview.com/surveys/article/41418/analysis­part­3 3/15 US (DOJ) 3,200 France 881.3 Spain 506 Korea 473.9 DG Comp 364.5 Italy 235 Germany 208 Belgium 173.8 India 134 Switzerland 75 Colombia 74.7 Czech Republic 74.6 Chile 55 Brazil 45 Romania 42 Austria 34.5 Russia 21.1 Japan 18 Netherlands 15.2 Mexico 5.2 Sweden 3 New Zealand 2.2 Norway 2.1 Lithuania 2 Canada 1.97 UK 1.3 Pakistan 1.18 Israel 1 Denmark 0.981 Portugal 0.83 Latvia 0.3 Poland 0.28 Australia 0 Finland 0 Ireland 0 Singapore 0 Turkey 0
- 5. 27.07.2016 Analysis:¬†Part¬†3¬†¬≠¬†GCR¬†¬≠¬†Global¬†Competition¬†Review http://globalcompetitionreview.com/surveys/article/41418/analysis¬≠part¬≠3 5/15 closed¬†cartel¬†investigations. The¬†number¬†of¬†dawn¬†raids¬†(see¬†table¬†24)¬†conducted¬†by¬†enforcement agencies¬†changed¬†considerably¬†in¬†2015.¬†TurkeyвАЩs¬†Competition Authority¬†remains¬†the¬†world¬†leader,¬†with¬†96¬†dawn¬†raids¬†conducted¬†вАУ thatвАЩs¬†20¬†more¬†than¬†in¬†2014.¬†Given¬†that¬†GCR¬†asks¬†agencies¬†not¬†to¬†refer to¬†the¬†number¬†of¬†searched¬†premises,¬†but¬†to¬†the¬†number¬†of¬†cases¬†in which¬†dawn¬†raids¬†were¬†conducted,¬†it¬†is¬†an¬†impressively¬†high¬†number. KoreaвАЩs¬†Fair¬†Trade¬†Commission¬†and¬†GermanyвАЩs¬†Federal¬†Cartel¬†Office remain¬†reliably¬†busyЌЊ¬†they¬†respectively¬†conducted¬†49¬†and¬†14¬†raids last¬†year,¬†taking¬†the¬†fourth¬†and¬†fifth¬†places¬†in¬†the¬†table.¬†Colombia,¬†a new¬†entrant¬†to¬†Rating¬†Enforcement¬†this¬†year,¬†conducted¬†57¬†raids,¬†placing¬†it¬†in second¬†on¬†our¬†list. Table¬†24:¬†Number¬†of¬†dawn¬†raids Authority No.¬†of¬†dawn¬†raids Turkey 96 Colombia 57 Korea 49 Germany 14 Austria 12 Russia 12 Italy 11 Spain 10 Greece 8 Latvia 8 Romania 8 Czech¬†Republic 7 Denmark 7 Mexico 7 France 6 Lithuania 6 Poland 6 Finland 5 Switzerland 5 Canada 4
- 6. 27.07.2016 Analysis: Part 3 ­ GCR ­ Global Competition Review http://globalcompetitionreview.com/surveys/article/41418/analysis­part­3 6/15 Canada 4 DG Comp 4 Israel 4 Netherlands 4 Australia 3 UK 3 Belgium 2 Brazil 2 Ireland 2 Portugal 2 Singapore 2 Chile 1 India 1 Norway 1 Pakistan 1 New Zealand 0 Sweden 0 Table 25: Average duration of a cartel investigation Authority Average length of cartel investigation (months) Chile 589 Belgium 105 Denmark 62 Romania 56 Brazil 49.2 DG Comp 48 Greece 42 Germany 36 India 36 UK 34 Canada 29 Korea 25 Australia 24 Colombia 24 Ireland 24 Switzerland 23.5 Mexico 23 Spain 22
- 7. 27.07.2016 Analysis: Part 3 ­ GCR ­ Global Competition Review http://globalcompetitionreview.com/surveys/article/41418/analysis­part­3 7/15 Spain 22 Czech Republic 19 Lithuania 19 Finland 18 France 18 Italy 18 Portugal 18 Sweden 17 Japan 15 Singapore 14 Israel 12 Netherlands 12 Russia 12 Latvia 11 Poland 10 Turkey 8 New Zealand 5.5 Pakistan 4 Table 26: Total number of dominance investigations opened Authority No. of abuse investigations opened Russia 3,059 DG Comp 35 Denmark 31 Brazil 30 France 30 US (FTC) 25 Korea 24 India 23 Poland 23 Austria 22 Chile 18 Germany 14 Greece 10 Turkey 10 Australia 9 Sweden 9 Canada 7
- 8. 27.07.2016 Analysis:¬†Part¬†3¬†¬≠¬†GCR¬†¬≠¬†Global¬†Competition¬†Review http://globalcompetitionreview.com/surveys/article/41418/analysis¬≠part¬≠3 8/15 Canada 7 Finland 7 Mexico 6 Pakistan 6 Spain 4 Italy 3 Romania 3 Belgium 2 Colombia 2 New¬†Zealand 2 Portugal 2 Ireland 1 Israel 1 Netherlands 1 UK 1 Czech¬†Republic 0 Latvia 0 Lithuania 0 Singapore 0 Switzerland 0 Norway 0 As¬†ever,¬†technology¬†continues¬†to¬†shift¬†power¬†in¬†the¬†global marketplace,¬†leaving¬†antitrust¬†enforcers¬†scrambling¬†to¬†catch¬†up¬†to companies¬†that¬†have¬†mastered¬†new¬†technologies¬†and,¬†in¬†doing¬†so, have¬†become¬†dominant¬†in¬†their¬†respective¬†industries.¬†Antitrust¬†case law¬†books¬†are¬†riddled¬†with¬†examples¬†of¬†such¬†enforcementЌЊ¬†think¬†of the¬†transatlantic¬†investigations¬†of¬†Microsoft¬†at¬†the¬†turn¬†of¬†the¬†20th century.¬†At¬†the¬†moment,¬†the¬†countries¬†at¬†the¬†top¬†of¬†this¬†yearвАЩs dominance¬†tables¬†are¬†building¬†new¬†case¬†law. Russia¬†is¬†something¬†of¬†an¬†exception¬†hereЌЊ¬†because¬†of¬†the¬†countryвАЩs antitrust¬†law¬†and¬†the¬†Federal¬†Antimonopoly¬†ServiceвАЩs¬†structure,¬†a¬†host of¬†minor¬†matters¬†are¬†considered¬†dominance¬†investigations.¬†This bloats¬†the¬†agencyвАЩs¬†statistics¬†beyond¬†the¬†work¬†it¬†does¬†on¬†major cases,¬†including¬†its¬†case¬†against¬†Google.¬†Below¬†Russia,¬†the¬†top¬†of
- 10. 27.07.2016 Analysis:¬†Part¬†3¬†¬≠¬†GCR¬†¬≠¬†Global¬†Competition¬†Review http://globalcompetitionreview.com/surveys/article/41418/analysis¬≠part¬≠3 10/15 establish¬†their¬†presence¬†in¬†an¬†economy¬†and¬†score¬†secure,¬†and¬†what the¬†enforcer¬†may¬†see¬†as¬†easy,¬†victories¬†against¬†powerful¬†local companies.¬†вАЬThis¬†can¬†really¬†happen¬†anywhere¬†вАУ¬†where¬†local competition¬†authorities¬†are¬†coming¬†under¬†pressure¬†to¬†вАЬdo¬†somethingвАЭ against¬†large¬†companies¬†by¬†the¬†general¬†populace,вАЭ¬†Reysen¬†says.¬†вАЬIn this¬†respect,¬†any¬†very¬†successful¬†company¬†вАУ¬†whether¬†it¬†is¬†soft¬†drink manufacturer¬†or¬†operator¬†of¬†a¬†chain¬†of¬†cinemas¬†вАУ¬†may¬†be¬†a¬†target¬†of enforcement¬†behaviour.вАЭ These¬†kinds¬†of¬†cases¬†may¬†be¬†deceptively¬†easy¬†to¬†bring,¬†Reysen says,¬†but¬†if¬†the¬†targeted¬†company¬†does¬†in¬†fact¬†have¬†a¬†significant share¬†of¬†a¬†supply¬†market,¬†they¬†may¬†be¬†keen¬†to¬†settle¬†their¬†exposure quickly.¬†They¬†may¬†not¬†be¬†headline¬≠grabbingcases¬†against¬†major companies,¬†but¬†if¬†a¬†client¬†is¬†the¬†target¬†of¬†such¬†a¬†probe,¬†theyвАЩll¬†likely¬†be just¬†as¬†unhappy,¬†he¬†says. Table¬†27:¬†Total¬†number¬†of¬†dominance¬†investigations¬†closed Authority No.¬†of¬†abuse investigations¬†closed Russia 2,542 Brazil 73 DG¬†Comp 52 Greece 47 India 44 Poland 29 Denmark 26 Chile 25 Germany 20 France 16 Finland 10 Canada 8 Korea 8 Sweden 7 Turkey 6 Australia 5
- 11. 27.07.2016 Analysis: Part 3 ­ GCR ­ Global Competition Review http://globalcompetitionreview.com/surveys/article/41418/analysis­part­3 11/15 Colombia 5 Spain 5 Belgium 3 Italy 3 Mexico 3 Pakistan 3 Portugal 3 Singapore 3 Czech Republic 2 Romania 2 Switzerland 1.5 Ireland 1 Israel 1 Japan 1 Latvia 1 Lithuania 1 UK 1 Netherlands 0 New Zealand 0 Norway 0 US (FTC) 0 Table 28: Average duration of dominance investigations Authority Average duration of abuse investigation (months) Sweden 383 Portugal 57 Brazil 49 Romania 49 Belgium 38 DG Comp 31 Czech Republic 30 Switzerland 25 UK 25 Colombia 24 Latvia 24 Singapore 22 Spain 22
- 12. 27.07.2016 Analysis: Part 3 ­ GCR ­ Global Competition Review http://globalcompetitionreview.com/surveys/article/41418/analysis­part­3 12/15 Spain 22 India 18 Finland 18 France 18 Israel 18 Canada 17 Italy 16 Lithuania 16 Korea 15 Mexico 15 Australia 12 Germany 12 Poland 11 Chile 10 Denmark 9 Turkey 8 Greece 4.5 Pakistan 4 Table 29: Longest­running dominance investigation Authority Longest running invesigation (months) Brazil 132 Poland 132 US (FTC) 114 Canada 102 DG Comp 97 France 96 Belgium 72 Greece 72 UK 66 Finland 60 Czech Republic 57 Chile 54 Portugal 50 Colombia 48 Ireland 48 Norway 48 Romania 40
- 13. 27.07.2016 Analysis: Part 3 ­ GCR ­ Global Competition Review http://globalcompetitionreview.com/surveys/article/41418/analysis­part­3 13/15 Romania 40 Sweden 36 Switzerland 36 Denmark 31 Australia 27 Korea 27 Latvia 24 Mexico 23 Lithuania 22.5 Spain 22 Netherlands 19 Italy 17 Turkey 15 Israel 13 New Zealand 7 Pakistan 5 Table 30: Dominance investigations ended with commitments Authority No. of investigations closed w/ commitments Russia 1,913 Brazil 16 Poland 11 India 7 France 6 Chile 4 Australia 3 Italy 2 Singapore 2 Spain 2 US (FTC) 2 Canada 1 DG Comp 1 Finland 1 Greece 1 Latvia 1 Mexico 1 Romania 1 Sweden 1
- 14. 27.07.2016 Analysis: Part 3 ­ GCR ­ Global Competition Review http://globalcompetitionreview.com/surveys/article/41418/analysis­part­3 14/15 Sweden 1 Table 31: Percentage of budget spent on advocacy Authority Per cent of budget dedicated to advocacy Singapore 36 Mexico 21 Finland 18 Israel 15 Switzerland 10 Denmark 10 Pakistan 10 New Zealand 8 Spain 5 Greece 5 Poland 5 Belgium 4 UK 3 Australia 2 Canada 2 US (FTC) 2 Korea 2 Turkey 2 Lithuania 2 Austria 1 Table 32: Number of appearances before lawmakers Authority Appearances before lawmakers France 23 Chile 20 Japan 17 Germany 15 DG Comp 12 Australia 11 Czech Republic 11 Russia 10 Italy 9
- 15. 27.07.2016 Analysis: Part 3 ­ GCR ­ Global Competition Review http://globalcompetitionreview.com/surveys/article/41418/analysis­part­3 15/15 Copyright © 2016 Law Business Research Ltd. All rights reserved. | http://www.lbresearch.com 87 Lancaster Road, London, W11 1QQ, UK | Tel: +44 207 908 1188 / Fax: +44 207 229 6910 http://www.globcompetitionreview.com | editorial@globalcompetitionreview.com Italy 9 Lithuania 8 Finland 8 Poland 5 Brazil 5 Canada 5 Mexico 4 Portugal 4 US (FTC) 4 India 3 Netherlands 3 Pakistan 3 Austria 2 Spain 2 Colombia 1 Ireland 1 US (DOJ) 1


