際際滷

際際滷Share a Scribd company logo
Implementing Six Sigma Quality
at Better Body Manufacturing
D M A I
Define

Measure Analyze

C

Improve Control
D M A I

Overview

Define

Measure Analyze

C

Improve Control

ABC Incorporated (ABC) is not achieving Six Sigma quality levels for all critical
Body-Side Sub-Assembly dimensions as requested by their customers.
200000

Dimension

DPM

DPM

150000
100000

3874

ASM_10Y

776

ASM_6Y

4

ASM_6Y

0

ASM_9Y

ASM_10Y

50000

19786

ASM_9Y

85824

ASM_3Y

ASM_3Y

ASM_8Y

ASM_8Y

172475

ASM_7Y

ASM_7Y

Ensure that all critical body-side subassembly dimensions are within Six Sigma
quality levels of < 3.4 DPM. Cp  2.0 and Cpk  1.67.
 Determined the correlation between body side and assembly dimensions.
 Evaluated the significance of Tonnage > 935 for ASM_7Y & ASM_8Y.
 Conducted a DOE for Clamp position for ASM_9Y & ASM_10Y.
 Change tonnage to > 935 to correct ASM_7Y and ASM_8Y
 Set clamp position to location 2 for ASM_9Y and ASM_10Y
 Re-machine A-pillar die to correct A_3Y and ASM_3Y
2
Problem Statement & The Goal

D M A I
Define

Measure Analyze

C

Improve Control

ABC Incorporateds customer wants ABC to apply Six Sigma problem solving
methodology to insure that the body side subassembly is achieving Six Sigma quality
levels of less than 3.4 defects per million for all critical body side subassembly
dimensions.
ABC needs an improvement strategy that minimizes the rework costs while achieving the
desired quality objective. ABCs goal is to produce module subassemblies that meet the
customer requirements and not necessarily to insure that every individual stamped
component within the assembly meets it original print specifications  sub-system
optimizations vs. local optimization.
A-Pillar
Reinforcement

+

B-Pillar
Reinforcement

Body Side Outer

+

3
D M A I

Measure Phase

Define

Measure Analyze

C

Improve Control

Key Variables:
Assembly process variables:
Weld Pattern (density), Clamp Location, and Clamp Weld Pressure
Stamping process variables (body side):
Press Tonnage, Die Cushion Pressure, Material Thickness

Body Assembly Dimensions ASM_1Y through ASM_10Y
Assembly Dimensions with Highest Defects
200000

172475

DPM

150000

100000

85824

50000
19786
3874

776

4

0
ASM_7Y

ASM_8Y

ASM_3Y

ASM_9Y

ASM_10Y

ASM_6Y

4
Analyze Phase

D M A I
Define

Measure Analyze

C

Improve Control

Resolution alternatives (based upon past experience):
1. Make adjustments to assembly process settings
2. Reduce variation of components through better control of stamping
process input variables
3. Rework stamping dies to shift component mean deviation that is off
target and causing assembly defects
Target Performance Level:
All ten critical assembly dimensions at Six Sigma quality level of  3.4 DPM.
Cp  2.0 and Cpk  1.67
Fish Bone and P-Diagrams:
Understanding potential causes of defects. From this we pick the assembly and
component dimensions that require further analysis

5
D M A I

Analyze Phase

Define

Measure Analyze

C

Improve Control

Environment
Quality

Component
Variability

Inspection
Process
Clamp Weld
Pressure

Methods

Clamp
Location

For our analysis we will do a DOE to check
for levels that contribute to better quality
product.

Material Thickness
Yield Strength

Humidity

Gage R&R

Weld Pattern
(density)

Inputs

Temperature

Yield
Strength

Material
Thickness

Elastic
Limit
Materials

Operator

Training
Body
Assembly

Die Cushion
Pressure

Machine

Press
Tonnage

Control Variables
Clamp Location Press Tonnage
Weld Density
Die Pressure
Clamp Pressure

Body Side Sub-Assembly
Stamping Process

Outputs
Body Side Sub-Assemblies at
Six Sigma quality levels

Noise Variables
Environment
Inherent Variation

Error
States
Dimensional
defects
6
Analyze Phase

D M A I
Define

Measure Analyze

C

Improve Control

Analysis of ASM_7Y and ASM_8Y

Conclusion: BS_7Y and ASM_7Y are following a similar trend.
A correlation chart to study this further shows high correlation.
(Pearson correlation, R of 0.701).
7
D M A I

Analyze Phase
Capability of B_7Y

Define

Measure Analyze

C

Improve Control

Capability of BS_7Y

0 DPM

698416 DPM

Conclusion: B_7Y has 0 ppm compared to ~700K
DPM in BS_7Y.
Furthermore, BS_7Y shows strong correlation on
dimension ASM_7Y. (Pearson correlation, R of
0.786).
8
Analyze Phase

D M A I
Define

Measure Analyze

C

Improve Control

XY Plot of Tonnage vs. BS_7Y

Conclusion: Tonnage values above 935 greatly improves BS_7Y and brings it
closer to the mean. Lets see what impact this has on ASM dimensions 7Y, 8Y, 9Y,
and 10Y by creating a subset of the data looking only at Tonnage > 935.
9
D M A I

Analyze Phase

Define

Measure Analyze

C

Improve Control

Impact this has on ASM dimensions 7Y, 8Y, 9Y & 10Y on Tonnage
Capability Analysis of ASM_8Y at Tonnage > 935

Capability Analysis of ASM_7Y at Tonnage > 935
LSL

Process Data

USL

USL
Target

1.00
*

Within

LSL
Mean

-1.00
0.09

Overall

Sample N
StDev (Within)
StDev (Overall)

Process Data
1.00000

USL

USL
Within

-0.12833
12

StDev (Within)

Overall

0.101825

StDev (Overall)

0.163174
0.147855

LSL

*
-1.00000

Mean
Sample N

12

Target
LSL

0.089161

Potential (Within) Capability

Potential (Within) Capability
Cp
2.04
CPU

1.86

Cp
CPU

3.27
3.69

CPL
Cpk

2.23
1.86

CPL
Cpk

2.85
2.85

Cpm

*
Overall Capability

Pp
PPU
PPL
Ppk

2.25
2.05
2.46
2.05

-1.0

-0.5

Observed Performance
PPM < LSL
0.00
PPM > USL
0.00
PPM Total
0.00

0.0

0.5

Exp. "Within" Performance
PPM < LSL
0.00
PPM > USL
0.01
PPM Total
0.01

1.0

Cpm

Exp. "Overall" Performance
PPM < LSL
0.00
PPM > USL
0.00
PPM Total
0.00

*
Overall Capability

Pp
PPU
PPL
Ppk

3.74
4.22
3.26
3.26

-1.0

Capability Analysis of ASM_9Y at Tonnage > 935
Process Data
USL
1.00000
Target
*
LSL
-1.00000
Mean
0.52083
Sample N
12
StDev (Within)
0.206010
StDev (Overall)
0.177098

LSL

*
Overall Capability

Pp
PPU
PPL
Ppk

1.88
0.90
2.86
0.90

0.0

0.5

Exp. "Within" Performance
PPM < LSL
0.00
PPM > USL
0.00
PPM Total
0.00

1.0
Exp. "Overall" Performance
PPM < LSL
0.00
PPM > USL
0.00
PPM Total
0.00

Capability Analysis of ASM_10Y at Tonnage > 935

USL
Within
Overall

Potential (Within) Capability
Cp
1.62
CPU
0.78
CPL
2.46
Cpk
0.78
Cpm

-0.5

Observed Performance
PPM < LSL
0.00
PPM > USL
0.00
PPM Total
0.00

Process Data
USL
1.00
Target
*
LSL
-1.00
Mean
0.39
Sample N
12
StDev (Within)
0.215541
StDev (Overall)
0.187663

LSL

USL
Within
Overall

Potential (Within) Capability
Cp
1.55
CPU
0.94
CPL
2.15
Cpk
0.94

-1.0

-0.5

Observed Performance
PPM < LSL
0.00
PPM > USL
0.00
PPM Total
0.00

0.0

0.5

Exp. "Within" Performance
PPM < LSL
0.00
PPM > USL
10010.77
PPM Total
10010.77

1.0
Exp. "Overall" Performance
PPM < LSL
0.00
PPM > USL
3408.51
PPM Total
3408.51

Cpm

*
Overall Capability

Pp
PPU
PPL
Ppk

1.78
1.08
2.47
1.08

-1.0

-0.5

Observed Performance
PPM < LSL
0.00
PPM > USL
0.00
PPM Total
0.00

0.0

0.5

Exp. "Within" Performance
PPM < LSL
0.00
PPM > USL
2326.72
PPM Total
2326.72

1.0
Exp. "Overall" Performance
PPM < LSL
0.00
PPM > USL
576.00
PPM Total
576.00

Conclusion: Setting Tonnage to greater than 935 resulted in ASM_7Y and ASM_8Y
meeting the goal of <3.4 DPM. ASM_9Y and ASM_10Y require further analysis.
10
D M A I

Analyze Phase

Define

Measure Analyze

C

Improve Control

DOE for Response Variable ASM_9Y
 DOE factorial analysis shows Clamp Position is the only significant factor in
determining ASM_9Y dimension
Input Variable

Proposed ASM_9Y Setting

Proposed ASM_10Y Setting

DOE Response Optimization for ASM_9YLocation
Clamp
Location 2
Location 2
Weld Density (welds per X inches)
1.33
1.33
 Set Clamp Position to Location 2 (level 1)
Clamp Pressure
2100 psi
2100 psi
 Optimizer recommends setting Weld Density to 1.33 weld per inch (level 1),

but this appears to be a robust parameter, which could be changed for the benefit
of process without reducing quality if processing time or cost shows a benefit.
 Optimizer recommends setting Clamp Pressure to 2100 psi (level 1), but this
appears to be a robust parameter, which could be changed for the benefit of process
without reducing quality if processing time or cost shows a benefit.
 Run additional tests at recommended settings to confirm results
 Weld Density and Clamp Pressure are robust parameters and can be set to optimize
the process capability to maximum level and lowest cost.
11
Analyze Phase

D M A I
Define

Measure Analyze

C

Improve Control

DOE for Response Variable ASM_10Y
 DOE factorial analysis shows Clamp Position is also the only significant
factor in determining ASM_10Y dimension
DOE Response Optimization for ASM_10Y
 Setting clamp to location 2 also improves ASM_10Y
 Recommend same settings used to improve ASM_9Y to improve process
capability which also allows for no changes to machine setup and helps reduce
possible process concerns
 Run additional tests at recommended settings to confirm results
 Weld Density and Clamp Pressure are robust parameters and can be set to optimize
the process capability to maximum level and lowest cost.

12
Analyze Phase

D M A I
Define

Measure Analyze

C

Improve Control

DOE for Response Variable ASM_3Y
 DOE factorial analysis shows that no factors are significant
 Response Optimization shows no solution for response optimizer
Observe Process Capability of A_3Y and BS_3Y
 ASM_3Y and A_3Y have a similar mean shift in the -Y direction
Correlation of Output Variables
 No dimensional correlations appear to exist between ASM_3Y and
A_3Y or BS_3Y
Stepwise Regression Analysis of BS_3Y
 Tonnage and Die Pressure appear to be significant in determining
dimension BS_3Y
 Tonnage values < 920 may improve BS_3Y
 Die Pressure appears to have no clear correlation to BS_3Y
13
D M A I

Analyze Phase

Define

Measure Analyze

C

Improve Control

Process Capability of BS_ 3Y and ASM_3Y at Tonnage < 920
 Created subset of body data looking only at dimensions with Tonnage < 935
 Tonnage < 920 appears to improve the mean of BS_3Y slightly, but has no
impact on improving the mean of ASM_3Y.
Capability Analysis of ASM_3Y
Die remachined to move mean +0.80

Capability of A_3Y and ASM_3Y with +0.80
mm mean offset

LSL

Process Data

USL

USL
Target

1
*

Within

LSL
Mean

-1
0

Overall

Sample N
36
StDev (Within) 0.0851436

 Manipulate data for A_3Y and ASM_3Y
by +0.80 mm to simulate re-machining

StDev (Overall) 0.0971725

Potential (Within) Capability
Cp
3.91
CPU
CPL

3.91
3.91

Cpk

3.91

Cpm

 Process capability shows 0 defects for
A_3Y and ASM_3Y with this mean offset

*
Overall Capability

-1.0

-0.5

0.0

0.5

1.0

Pp

3.43

Observed Performance
PPM < LSL
0.00

Exp. "Within" Performance
PPM < LSL
0.00

Exp. "Overall" Performance
PPM < LSL
0.00

PPU

3.43

PPM > USL

0.00

PPM > USL

0.00

PPM > USL

0.00

PPL
Ppk

3.43
3.43

PPM Total

0.00

PPM Total

0.00

PPM Total

0.00

14
Analyze Phase

D M A I
Define

Measure Analyze

C

Improve Control

Conclusions
 From the analysis of ASM_7Y and ASM_8Y we can conclude that:


Setting tonnage > 935 results in ASM_7Y and ASM_8Y meeting the goal

 Analyzing ASM_9Y and ASM_10Y helps determine that:


Setting clamp position to location 2, weld density to 1 weld every 1.33
and clamp pressure to 2000 psi helps with dimensions ASM_9Y and
ASM_10Y

 Analyzing ASM_3Y helps us conclude that:


Re-machine A-Pillar die to move A_3Y to nominal  which could cause
BS_3Y to shift towards nominal  effectively shifting ASM_3Y to nominal

15
D M A I

Analyze Phase

Define

Measure Analyze

C

Improve Control

With the recommended changes the process performance will improve significantly
Dimension Mean

StDev
Overall

DPM_Obsv DPM_Within DPM_Exp

Pp

Ppk

Cp

Cpk

ASM_1Y

-0.035

0.165

0

0

0

2.01

1.94

2.47

2.39

ASM_2Y

0.259

0.152

0

0

1

2.20

1.63

2.31

1.71

ASM_3Y

0.000

0.097

0

0

0

ASM_4Y

0.009

0.115

0

0

0

2.90

2.87

3.53

3.50

ASM_5Y

-0.330

0.145

0

0

2

2.30

1.54

3.72

2.50

ASM_6Y

-0.284

0.160

0

1

4

2.08

1.49

2.24

1.60

ASM_7Y

0.090

0.148

0

0

0

2.25

2.05

2.04

1.86

ASM_8Y

-0.128

0.089

0

0

0

3.74

3.26

3.27

2.85

ASM_9Y

0.521

0.180

0

0

0

ASM_10Y

0.395

0.191

0

0

0

16
Improve Phase

D M A I
Define

Measure Analyze

C

Improve Control

Recommendations for improving the process:
 Set Tonnage to above 935 to improve ASM_7Y & ASM_8Y
 Set Clamp to Location 2 to improve ASM_9Y & ASM_10Y
 Re-machine the A-Pillar die to move the mean of A_3Y to nominal which in turn

will move ASM_3Y to nominal

Implement the above recommendations and run additional samples to verify results.

17
Control Phase

D M A I
Define

Measure Analyze

C

Improve Control

Recommended controls :
 Implement a gauge on the body side component press to monitor tonnage
 Implement an alarm and shut-off feature on the body side press if tonnage

falls below 935 tons
 Implement poke-yoke clamping fixture that ensures clamp is always in

Position 2
 Establish an affordable control plan for ongoing monitoring of the 10

critical assembly dimensions.

18
Summary

D M A I
Define

Measure Analyze

C

Improve Control

ABC Incorporated is not achieving Six Sigma quality levels for all critical BodySide Sub-Assembly dimensions as requested by their customers. BBM needs to
apply Six Sigma problem solving methodology to establish an improvement strategy
that minimizes rework costs, yet achieves the desired quality objective.
Bring the key process output variables within Six Sigma quality level of < 3.4 DPM.
Cp  2.0 and Cpk  1.67
Set Tonnage to above 935 to improve ASM_7Y & ASM_8Y
 Set Clamp to Location 2 to improve ASM_9Y & ASM_10Y
 Re-machine the A-Pillar die to move the mean of A_3Y to nominal


Implement a gauge on the body side component press to monitor tonnage
 Implement an alarm & shut-off feature on body side press if tonnage falls below 935
 Implement poke-yoke clamping fixture that ensures clamp is always in Position 2
 Establish control plan for ongoing monitoring of the 10 critical assembly dimensions.


19
Ad

Recommended

Enhancing the Submersible Pump Rotor Performance by Taguchi Optimization Tech...
IRJET Journal
Dynamic Modulus Master Curve Construction Using Christensen-Anderson-Marastea...
IJERA Editor
C0941217
C0941217
IOSR Journals
IRJET- Parametric Optimization of Co2 Welding on Fe410 using Taguchi Tech...
IRJET Journal
30120140501011 2-3
30120140501011 2-3
IAEME Publication
IRJET- Parametric Optimisation of Submerged ARC Welding Process by using Resp...
IRJET Journal
Power point
Power point
Uguet
How to start business in america final
Marie Buhot-Launay
ind Marina uguet iba単ez A1
Uguet
Examen de inform叩tica 1 a astudillo juan
Juan Astudillo Ben鱈tez
Social Media in Action
Andrea Pecoraro
Learning expedition boston 2013 presentation fr labos_v1
Marie Buhot-Launay
ind Marina Uguet Iba単ez A1
Uguet
taula de formats Marina Uguet A1
Uguet
Sscasestudy (1)
Sscasestudy (1)
SHASHI P MISHRA
Beers, Blogs & Business
Andrea Pecoraro
Six sigma-statistical-definition-2
SHASHI P MISHRA
Learning expedition boston 2013 presentation fr vf-
Marie Buhot-Launay
2012 uesjls-1属a-t1 ex-astudillo.ben鱈tez
Juan Astudillo Ben鱈tez
Banking in Japan ( final edit)
encargo
130315 hubtech21 presentation
Marie Buhot-Launay
130208 french tech hub presentation final
Marie Buhot-Launay
CULTURA VALDIVIA
JuanchoBSC
Implementing Six Sigma Quality at Better Body Manufacturing .ppt
YeZachary
sscasestudy.ppt
sscasestudy.ppt
mohammad327327
Example -BB Powertrain
Peter Zhou
Black belt Project -Process optimization DV Cyl Head.pptx
vasant bhoknal
360 SIMS - The Power of large data for 3D metrology and process control
Tal Vagman
Applying Lean Six Sigma to improve garment production processes-A case study
BOHR International Journal of Operations Management Research and Practices
Design for Six Sigma in Automotive
Julian Kalac P.Eng

More Related Content

Viewers also liked (15)

ind Marina uguet iba単ez A1
Uguet
Examen de inform叩tica 1 a astudillo juan
Juan Astudillo Ben鱈tez
Social Media in Action
Andrea Pecoraro
Learning expedition boston 2013 presentation fr labos_v1
Marie Buhot-Launay
ind Marina Uguet Iba単ez A1
Uguet
taula de formats Marina Uguet A1
Uguet
Sscasestudy (1)
Sscasestudy (1)
SHASHI P MISHRA
Beers, Blogs & Business
Andrea Pecoraro
Six sigma-statistical-definition-2
SHASHI P MISHRA
Learning expedition boston 2013 presentation fr vf-
Marie Buhot-Launay
2012 uesjls-1属a-t1 ex-astudillo.ben鱈tez
Juan Astudillo Ben鱈tez
Banking in Japan ( final edit)
encargo
130315 hubtech21 presentation
Marie Buhot-Launay
130208 french tech hub presentation final
Marie Buhot-Launay
CULTURA VALDIVIA
JuanchoBSC
ind Marina uguet iba単ez A1
Uguet
Examen de inform叩tica 1 a astudillo juan
Juan Astudillo Ben鱈tez
Social Media in Action
Andrea Pecoraro
Learning expedition boston 2013 presentation fr labos_v1
Marie Buhot-Launay
ind Marina Uguet Iba単ez A1
Uguet
taula de formats Marina Uguet A1
Uguet
Beers, Blogs & Business
Andrea Pecoraro
Six sigma-statistical-definition-2
SHASHI P MISHRA
Learning expedition boston 2013 presentation fr vf-
Marie Buhot-Launay
2012 uesjls-1属a-t1 ex-astudillo.ben鱈tez
Juan Astudillo Ben鱈tez
Banking in Japan ( final edit)
encargo
130315 hubtech21 presentation
Marie Buhot-Launay
130208 french tech hub presentation final
Marie Buhot-Launay
CULTURA VALDIVIA
JuanchoBSC

Similar to Sscasestudy (20)

Implementing Six Sigma Quality at Better Body Manufacturing .ppt
YeZachary
sscasestudy.ppt
sscasestudy.ppt
mohammad327327
Example -BB Powertrain
Peter Zhou
Black belt Project -Process optimization DV Cyl Head.pptx
vasant bhoknal
360 SIMS - The Power of large data for 3D metrology and process control
Tal Vagman
Applying Lean Six Sigma to improve garment production processes-A case study
BOHR International Journal of Operations Management Research and Practices
Design for Six Sigma in Automotive
Julian Kalac P.Eng
six sigma DMAIC approach for reducing quality defects of camshaft binding pro...
Niranjana B
Vitaletti Leonardo, Elica Motors - Design for Six Sigma ed applicazioni minit...
GMSL S.r.l.
Building best in-class quality in footwear manufacturing
Tony Lopez
DFSS short
DFSS short
Chaitanya Chenna
Six Sigma Project = Internet Sample
antonioharenas
3D final
3D final
SHIVA TEJA SEPURI
30120130405014
30120130405014
IAEME Publication
To Improve Quality and Reduce Rejection Level through Quality Control
rahulmonikasharma
Manufacturing Process Engineering Project Samples.
Akshar Vasekar
Project_report
Project_report
Rohit Rajendran
Error Proofing Projects
RonFife
Sandeep six sigma ppt
MINDA KYORAKU LIMITED
q-Maxims approach to waste reduction in foundry application using Taguchi ...
q-Maxim
Implementing Six Sigma Quality at Better Body Manufacturing .ppt
YeZachary
Example -BB Powertrain
Peter Zhou
Black belt Project -Process optimization DV Cyl Head.pptx
vasant bhoknal
360 SIMS - The Power of large data for 3D metrology and process control
Tal Vagman
Design for Six Sigma in Automotive
Julian Kalac P.Eng
six sigma DMAIC approach for reducing quality defects of camshaft binding pro...
Niranjana B
Vitaletti Leonardo, Elica Motors - Design for Six Sigma ed applicazioni minit...
GMSL S.r.l.
Building best in-class quality in footwear manufacturing
Tony Lopez
Six Sigma Project = Internet Sample
antonioharenas
To Improve Quality and Reduce Rejection Level through Quality Control
rahulmonikasharma
Manufacturing Process Engineering Project Samples.
Akshar Vasekar
Error Proofing Projects
RonFife
q-Maxims approach to waste reduction in foundry application using Taguchi ...
q-Maxim
Ad

Sscasestudy

  • 1. Implementing Six Sigma Quality at Better Body Manufacturing D M A I Define Measure Analyze C Improve Control
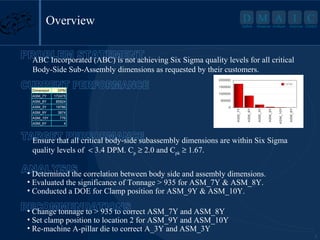
  • 2. D M A I Overview Define Measure Analyze C Improve Control ABC Incorporated (ABC) is not achieving Six Sigma quality levels for all critical Body-Side Sub-Assembly dimensions as requested by their customers. 200000 Dimension DPM DPM 150000 100000 3874 ASM_10Y 776 ASM_6Y 4 ASM_6Y 0 ASM_9Y ASM_10Y 50000 19786 ASM_9Y 85824 ASM_3Y ASM_3Y ASM_8Y ASM_8Y 172475 ASM_7Y ASM_7Y Ensure that all critical body-side subassembly dimensions are within Six Sigma quality levels of < 3.4 DPM. Cp 2.0 and Cpk 1.67. Determined the correlation between body side and assembly dimensions. Evaluated the significance of Tonnage > 935 for ASM_7Y & ASM_8Y. Conducted a DOE for Clamp position for ASM_9Y & ASM_10Y. Change tonnage to > 935 to correct ASM_7Y and ASM_8Y Set clamp position to location 2 for ASM_9Y and ASM_10Y Re-machine A-pillar die to correct A_3Y and ASM_3Y 2
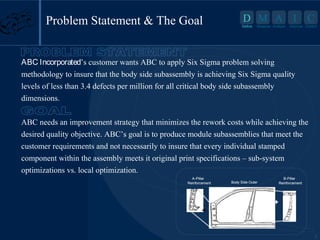
  • 3. Problem Statement & The Goal D M A I Define Measure Analyze C Improve Control ABC Incorporateds customer wants ABC to apply Six Sigma problem solving methodology to insure that the body side subassembly is achieving Six Sigma quality levels of less than 3.4 defects per million for all critical body side subassembly dimensions. ABC needs an improvement strategy that minimizes the rework costs while achieving the desired quality objective. ABCs goal is to produce module subassemblies that meet the customer requirements and not necessarily to insure that every individual stamped component within the assembly meets it original print specifications sub-system optimizations vs. local optimization. A-Pillar Reinforcement + B-Pillar Reinforcement Body Side Outer + 3
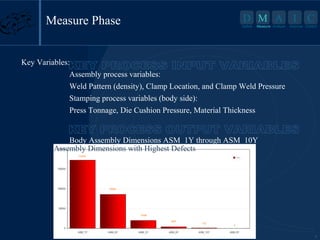
  • 4. D M A I Measure Phase Define Measure Analyze C Improve Control Key Variables: Assembly process variables: Weld Pattern (density), Clamp Location, and Clamp Weld Pressure Stamping process variables (body side): Press Tonnage, Die Cushion Pressure, Material Thickness Body Assembly Dimensions ASM_1Y through ASM_10Y Assembly Dimensions with Highest Defects 200000 172475 DPM 150000 100000 85824 50000 19786 3874 776 4 0 ASM_7Y ASM_8Y ASM_3Y ASM_9Y ASM_10Y ASM_6Y 4
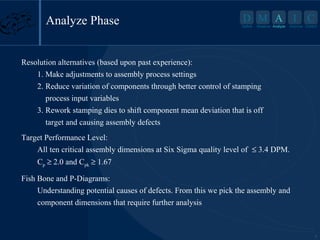
  • 5. Analyze Phase D M A I Define Measure Analyze C Improve Control Resolution alternatives (based upon past experience): 1. Make adjustments to assembly process settings 2. Reduce variation of components through better control of stamping process input variables 3. Rework stamping dies to shift component mean deviation that is off target and causing assembly defects Target Performance Level: All ten critical assembly dimensions at Six Sigma quality level of 3.4 DPM. Cp 2.0 and Cpk 1.67 Fish Bone and P-Diagrams: Understanding potential causes of defects. From this we pick the assembly and component dimensions that require further analysis 5
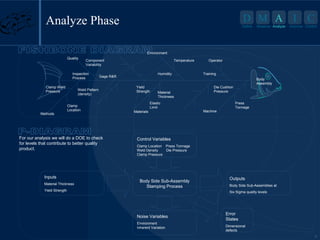
  • 6. D M A I Analyze Phase Define Measure Analyze C Improve Control Environment Quality Component Variability Inspection Process Clamp Weld Pressure Methods Clamp Location For our analysis we will do a DOE to check for levels that contribute to better quality product. Material Thickness Yield Strength Humidity Gage R&R Weld Pattern (density) Inputs Temperature Yield Strength Material Thickness Elastic Limit Materials Operator Training Body Assembly Die Cushion Pressure Machine Press Tonnage Control Variables Clamp Location Press Tonnage Weld Density Die Pressure Clamp Pressure Body Side Sub-Assembly Stamping Process Outputs Body Side Sub-Assemblies at Six Sigma quality levels Noise Variables Environment Inherent Variation Error States Dimensional defects 6
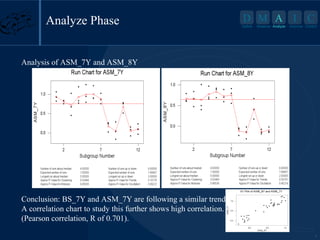
  • 7. Analyze Phase D M A I Define Measure Analyze C Improve Control Analysis of ASM_7Y and ASM_8Y Conclusion: BS_7Y and ASM_7Y are following a similar trend. A correlation chart to study this further shows high correlation. (Pearson correlation, R of 0.701). 7
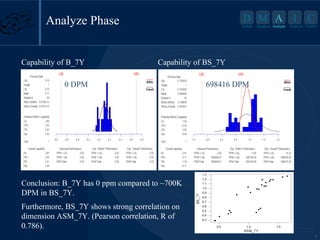
  • 8. D M A I Analyze Phase Capability of B_7Y Define Measure Analyze C Improve Control Capability of BS_7Y 0 DPM 698416 DPM Conclusion: B_7Y has 0 ppm compared to ~700K DPM in BS_7Y. Furthermore, BS_7Y shows strong correlation on dimension ASM_7Y. (Pearson correlation, R of 0.786). 8
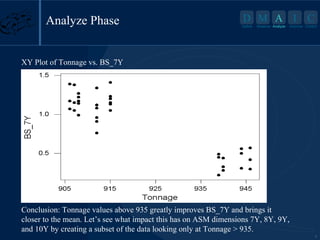
  • 9. Analyze Phase D M A I Define Measure Analyze C Improve Control XY Plot of Tonnage vs. BS_7Y Conclusion: Tonnage values above 935 greatly improves BS_7Y and brings it closer to the mean. Lets see what impact this has on ASM dimensions 7Y, 8Y, 9Y, and 10Y by creating a subset of the data looking only at Tonnage > 935. 9
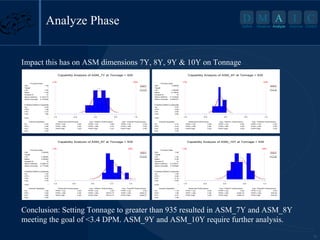
  • 10. D M A I Analyze Phase Define Measure Analyze C Improve Control Impact this has on ASM dimensions 7Y, 8Y, 9Y & 10Y on Tonnage Capability Analysis of ASM_8Y at Tonnage > 935 Capability Analysis of ASM_7Y at Tonnage > 935 LSL Process Data USL USL Target 1.00 * Within LSL Mean -1.00 0.09 Overall Sample N StDev (Within) StDev (Overall) Process Data 1.00000 USL USL Within -0.12833 12 StDev (Within) Overall 0.101825 StDev (Overall) 0.163174 0.147855 LSL * -1.00000 Mean Sample N 12 Target LSL 0.089161 Potential (Within) Capability Potential (Within) Capability Cp 2.04 CPU 1.86 Cp CPU 3.27 3.69 CPL Cpk 2.23 1.86 CPL Cpk 2.85 2.85 Cpm * Overall Capability Pp PPU PPL Ppk 2.25 2.05 2.46 2.05 -1.0 -0.5 Observed Performance PPM < LSL 0.00 PPM > USL 0.00 PPM Total 0.00 0.0 0.5 Exp. "Within" Performance PPM < LSL 0.00 PPM > USL 0.01 PPM Total 0.01 1.0 Cpm Exp. "Overall" Performance PPM < LSL 0.00 PPM > USL 0.00 PPM Total 0.00 * Overall Capability Pp PPU PPL Ppk 3.74 4.22 3.26 3.26 -1.0 Capability Analysis of ASM_9Y at Tonnage > 935 Process Data USL 1.00000 Target * LSL -1.00000 Mean 0.52083 Sample N 12 StDev (Within) 0.206010 StDev (Overall) 0.177098 LSL * Overall Capability Pp PPU PPL Ppk 1.88 0.90 2.86 0.90 0.0 0.5 Exp. "Within" Performance PPM < LSL 0.00 PPM > USL 0.00 PPM Total 0.00 1.0 Exp. "Overall" Performance PPM < LSL 0.00 PPM > USL 0.00 PPM Total 0.00 Capability Analysis of ASM_10Y at Tonnage > 935 USL Within Overall Potential (Within) Capability Cp 1.62 CPU 0.78 CPL 2.46 Cpk 0.78 Cpm -0.5 Observed Performance PPM < LSL 0.00 PPM > USL 0.00 PPM Total 0.00 Process Data USL 1.00 Target * LSL -1.00 Mean 0.39 Sample N 12 StDev (Within) 0.215541 StDev (Overall) 0.187663 LSL USL Within Overall Potential (Within) Capability Cp 1.55 CPU 0.94 CPL 2.15 Cpk 0.94 -1.0 -0.5 Observed Performance PPM < LSL 0.00 PPM > USL 0.00 PPM Total 0.00 0.0 0.5 Exp. "Within" Performance PPM < LSL 0.00 PPM > USL 10010.77 PPM Total 10010.77 1.0 Exp. "Overall" Performance PPM < LSL 0.00 PPM > USL 3408.51 PPM Total 3408.51 Cpm * Overall Capability Pp PPU PPL Ppk 1.78 1.08 2.47 1.08 -1.0 -0.5 Observed Performance PPM < LSL 0.00 PPM > USL 0.00 PPM Total 0.00 0.0 0.5 Exp. "Within" Performance PPM < LSL 0.00 PPM > USL 2326.72 PPM Total 2326.72 1.0 Exp. "Overall" Performance PPM < LSL 0.00 PPM > USL 576.00 PPM Total 576.00 Conclusion: Setting Tonnage to greater than 935 resulted in ASM_7Y and ASM_8Y meeting the goal of <3.4 DPM. ASM_9Y and ASM_10Y require further analysis. 10
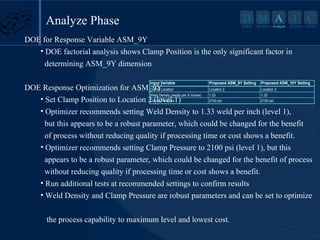
  • 11. D M A I Analyze Phase Define Measure Analyze C Improve Control DOE for Response Variable ASM_9Y DOE factorial analysis shows Clamp Position is the only significant factor in determining ASM_9Y dimension Input Variable Proposed ASM_9Y Setting Proposed ASM_10Y Setting DOE Response Optimization for ASM_9YLocation Clamp Location 2 Location 2 Weld Density (welds per X inches) 1.33 1.33 Set Clamp Position to Location 2 (level 1) Clamp Pressure 2100 psi 2100 psi Optimizer recommends setting Weld Density to 1.33 weld per inch (level 1), but this appears to be a robust parameter, which could be changed for the benefit of process without reducing quality if processing time or cost shows a benefit. Optimizer recommends setting Clamp Pressure to 2100 psi (level 1), but this appears to be a robust parameter, which could be changed for the benefit of process without reducing quality if processing time or cost shows a benefit. Run additional tests at recommended settings to confirm results Weld Density and Clamp Pressure are robust parameters and can be set to optimize the process capability to maximum level and lowest cost. 11
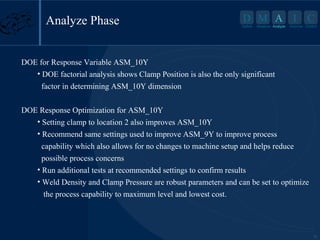
  • 12. Analyze Phase D M A I Define Measure Analyze C Improve Control DOE for Response Variable ASM_10Y DOE factorial analysis shows Clamp Position is also the only significant factor in determining ASM_10Y dimension DOE Response Optimization for ASM_10Y Setting clamp to location 2 also improves ASM_10Y Recommend same settings used to improve ASM_9Y to improve process capability which also allows for no changes to machine setup and helps reduce possible process concerns Run additional tests at recommended settings to confirm results Weld Density and Clamp Pressure are robust parameters and can be set to optimize the process capability to maximum level and lowest cost. 12
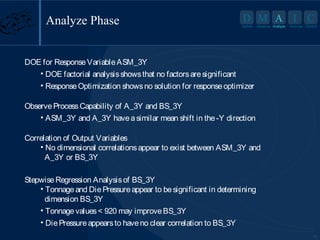
  • 13. Analyze Phase D M A I Define Measure Analyze C Improve Control DOE for Response Variable ASM_3Y DOE factorial analysis shows that no factors are significant Response Optimization shows no solution for response optimizer Observe Process Capability of A_3Y and BS_3Y ASM_3Y and A_3Y have a similar mean shift in the -Y direction Correlation of Output Variables No dimensional correlations appear to exist between ASM_3Y and A_3Y or BS_3Y Stepwise Regression Analysis of BS_3Y Tonnage and Die Pressure appear to be significant in determining dimension BS_3Y Tonnage values < 920 may improve BS_3Y Die Pressure appears to have no clear correlation to BS_3Y 13
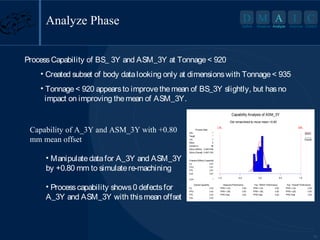
  • 14. D M A I Analyze Phase Define Measure Analyze C Improve Control Process Capability of BS_ 3Y and ASM_3Y at Tonnage < 920 Created subset of body data looking only at dimensions with Tonnage < 935 Tonnage < 920 appears to improve the mean of BS_3Y slightly, but has no impact on improving the mean of ASM_3Y. Capability Analysis of ASM_3Y Die remachined to move mean +0.80 Capability of A_3Y and ASM_3Y with +0.80 mm mean offset LSL Process Data USL USL Target 1 * Within LSL Mean -1 0 Overall Sample N 36 StDev (Within) 0.0851436 Manipulate data for A_3Y and ASM_3Y by +0.80 mm to simulate re-machining StDev (Overall) 0.0971725 Potential (Within) Capability Cp 3.91 CPU CPL 3.91 3.91 Cpk 3.91 Cpm Process capability shows 0 defects for A_3Y and ASM_3Y with this mean offset * Overall Capability -1.0 -0.5 0.0 0.5 1.0 Pp 3.43 Observed Performance PPM < LSL 0.00 Exp. "Within" Performance PPM < LSL 0.00 Exp. "Overall" Performance PPM < LSL 0.00 PPU 3.43 PPM > USL 0.00 PPM > USL 0.00 PPM > USL 0.00 PPL Ppk 3.43 3.43 PPM Total 0.00 PPM Total 0.00 PPM Total 0.00 14
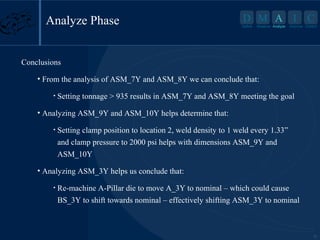
  • 15. Analyze Phase D M A I Define Measure Analyze C Improve Control Conclusions From the analysis of ASM_7Y and ASM_8Y we can conclude that: Setting tonnage > 935 results in ASM_7Y and ASM_8Y meeting the goal Analyzing ASM_9Y and ASM_10Y helps determine that: Setting clamp position to location 2, weld density to 1 weld every 1.33 and clamp pressure to 2000 psi helps with dimensions ASM_9Y and ASM_10Y Analyzing ASM_3Y helps us conclude that: Re-machine A-Pillar die to move A_3Y to nominal which could cause BS_3Y to shift towards nominal effectively shifting ASM_3Y to nominal 15
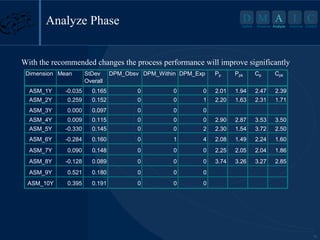
  • 16. D M A I Analyze Phase Define Measure Analyze C Improve Control With the recommended changes the process performance will improve significantly Dimension Mean StDev Overall DPM_Obsv DPM_Within DPM_Exp Pp Ppk Cp Cpk ASM_1Y -0.035 0.165 0 0 0 2.01 1.94 2.47 2.39 ASM_2Y 0.259 0.152 0 0 1 2.20 1.63 2.31 1.71 ASM_3Y 0.000 0.097 0 0 0 ASM_4Y 0.009 0.115 0 0 0 2.90 2.87 3.53 3.50 ASM_5Y -0.330 0.145 0 0 2 2.30 1.54 3.72 2.50 ASM_6Y -0.284 0.160 0 1 4 2.08 1.49 2.24 1.60 ASM_7Y 0.090 0.148 0 0 0 2.25 2.05 2.04 1.86 ASM_8Y -0.128 0.089 0 0 0 3.74 3.26 3.27 2.85 ASM_9Y 0.521 0.180 0 0 0 ASM_10Y 0.395 0.191 0 0 0 16
  • 17. Improve Phase D M A I Define Measure Analyze C Improve Control Recommendations for improving the process: Set Tonnage to above 935 to improve ASM_7Y & ASM_8Y Set Clamp to Location 2 to improve ASM_9Y & ASM_10Y Re-machine the A-Pillar die to move the mean of A_3Y to nominal which in turn will move ASM_3Y to nominal Implement the above recommendations and run additional samples to verify results. 17
  • 18. Control Phase D M A I Define Measure Analyze C Improve Control Recommended controls : Implement a gauge on the body side component press to monitor tonnage Implement an alarm and shut-off feature on the body side press if tonnage falls below 935 tons Implement poke-yoke clamping fixture that ensures clamp is always in Position 2 Establish an affordable control plan for ongoing monitoring of the 10 critical assembly dimensions. 18
  • 19. Summary D M A I Define Measure Analyze C Improve Control ABC Incorporated is not achieving Six Sigma quality levels for all critical BodySide Sub-Assembly dimensions as requested by their customers. BBM needs to apply Six Sigma problem solving methodology to establish an improvement strategy that minimizes rework costs, yet achieves the desired quality objective. Bring the key process output variables within Six Sigma quality level of < 3.4 DPM. Cp 2.0 and Cpk 1.67 Set Tonnage to above 935 to improve ASM_7Y & ASM_8Y Set Clamp to Location 2 to improve ASM_9Y & ASM_10Y Re-machine the A-Pillar die to move the mean of A_3Y to nominal Implement a gauge on the body side component press to monitor tonnage Implement an alarm & shut-off feature on body side press if tonnage falls below 935 Implement poke-yoke clamping fixture that ensures clamp is always in Position 2 Establish control plan for ongoing monitoring of the 10 critical assembly dimensions. 19