ºÝºÝߣ

ºÝºÝߣShare a Scribd company logo
The STaR Chart and Summerwood!
Agenda
1. What is the STaR Chart?

2. Competencies

3. State Statistics

4. Summerwood Statistics

5. Integration - Our Examples

6. Go to the Chart
What is the STaR Chart?
? The Texas Education Agency Educational
  Technology Advisory Committee (ETAC)
  developed the Texas School Technology and
  Readiness (STaR) Chart for self-assessment
  of a campus¡¯ and district¡¯s efforts to integrate
  technology across the curriculum.

? This chart is used to evaluate progress
  towards the Texas Long-Range Plan for
  Technology Integration.
                                                     Table of Contents
What are the Competencies?
   The Texas Teacher STaR Chart is an assessment tool
   developed around the 4 areas of the Texas Long Range
   Plan for Technology:

? Teaching and Learning

? Educator Preparation and Development

? Leadership Administration and Instructional Support

? Infrastructure for Technology
                                                          Table of Contents
State Reporting 2008
? In 2008 the State reported a summary
  of campus ratings regarding progress
  toward the long-range goals of the plan
  for technology.


                                            Table of Contents
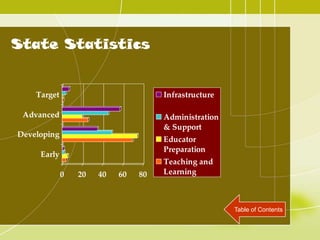
State Statistics


    Target                           Infrastructure

 Advanced                            Administration
                                     & Support
Developing
                                     Educator
                                     Preparation
     Early
                                     Teaching and
             0   20   40   60   80   Learning


                                                      Table of Contents
What is the point?
? The STaR Chart is used in technology planning, budgeting for
  resources, and evaluation.

? A prerequisite for all technology grants is a completed campus and
  district profile to indicate current levels and to serve as an evaluation
  tool.

? A basis for dialogue for staff, campus leaders, technology directors,
  and stakeholders.

? State reports are used to determine growth in meeting NCLB
  requirements for technology.

                                                                 Table of Contents
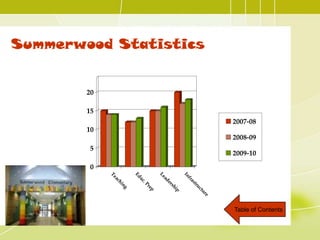
Summerwood Statistics


        20

        15
                                                                   2007-08
        10
                                                                   2008-09
         5
                                                                   2009-10
         0
             Te


                        Ed


                                     Le


                                                   In
                                                     fr
                                        ad
              ac


                           uc


                                                       as
                 h


                                           er
                              .


                                                       tru
                  in


                             Pr


                                            his
                    g


                                ep


                                                            ct
                                               p


                                                            ur
                                                               e
                                                                   Table of Contents
Ways we Integrate
Technology!


                    Clickers
                    and Mobis


                          Table of Contents
More Ways!

             Monster
             Exchange


                 Table of Contents
Table of Contents

More Related Content

STaR Chart Powerpoint

  • 1. The STaR Chart and Summerwood!
  • 2. Agenda 1. What is the STaR Chart? 2. Competencies 3. State Statistics 4. Summerwood Statistics 5. Integration - Our Examples 6. Go to the Chart
  • 3. What is the STaR Chart? ? The Texas Education Agency Educational Technology Advisory Committee (ETAC) developed the Texas School Technology and Readiness (STaR) Chart for self-assessment of a campus¡¯ and district¡¯s efforts to integrate technology across the curriculum. ? This chart is used to evaluate progress towards the Texas Long-Range Plan for Technology Integration. Table of Contents
  • 4. What are the Competencies? The Texas Teacher STaR Chart is an assessment tool developed around the 4 areas of the Texas Long Range Plan for Technology: ? Teaching and Learning ? Educator Preparation and Development ? Leadership Administration and Instructional Support ? Infrastructure for Technology Table of Contents
  • 5. State Reporting 2008 ? In 2008 the State reported a summary of campus ratings regarding progress toward the long-range goals of the plan for technology. Table of Contents
  • 6. State Statistics Target Infrastructure Advanced Administration & Support Developing Educator Preparation Early Teaching and 0 20 40 60 80 Learning Table of Contents
  • 7. What is the point? ? The STaR Chart is used in technology planning, budgeting for resources, and evaluation. ? A prerequisite for all technology grants is a completed campus and district profile to indicate current levels and to serve as an evaluation tool. ? A basis for dialogue for staff, campus leaders, technology directors, and stakeholders. ? State reports are used to determine growth in meeting NCLB requirements for technology. Table of Contents
  • 8. Summerwood Statistics 20 15 2007-08 10 2008-09 5 2009-10 0 Te Ed Le In fr ad ac uc as h er . tru in Pr his g ep ct p ur e Table of Contents
  • 9. Ways we Integrate Technology! Clickers and Mobis Table of Contents
  • 10. More Ways! Monster Exchange Table of Contents