stat
Download as DOCX, PDF0 likes445 views
This document provides sample data and examples for statistical hypothesis testing. It includes data on gender and ice cream flavor preferences, weight gain in cattle, online purchasing habits of graduate students, life satisfaction scores in older and younger adults, heart rate before and after meditation, and US history exam scores by college major. Statistical tests described include z-test, t-test, and ANOVA. The document serves as a reference for how to set up and analyze different types of statistical hypothesis tests using example data sets.
1 of 3
Download to read offline
Recommended
Final Draft Advanced


Final Draft AdvancedLiam Sprague
Ėý
This document discusses ADHD in youth. It describes ADHD as a disorder characterized by inattention, hyperactivity, and impulsiveness. While the causes are debated, research suggests it has both genetic and environmental factors. One study found maternal hostility was associated with higher ADHD symptoms in children, even after controlling for genetics. Other research has found certain genetic variants can increase risk and severity of ADHD. Diet may also impact ADHD symptoms, as one study found rats on a "Western-style" diet displayed more hyperactive and impulsive behaviors. Treatment approaches for ADHD, like stimulant medications, are controversial but some research has found medications can significantly reduce ADHD symptoms for many patients.Fox_SURF.PDF


Fox_SURF.PDFEmma Fox
Ėý
This study aimed to identify phenotypic predictors of quality of life (QOL) in youth with fragile X syndrome (FXS) by analyzing data from 27 individuals with FXS. The study found that social and school QOL were areas of reduced QOL compared to physical and emotional domains. High levels of irritability negatively correlated with family QOL. Significant social impairment also negatively correlated with individual QOL. Scores on measures of behaviors and abilities may help identify targets for clinical treatment to improve QOL. Larger and longitudinal studies are needed to generalize findings and track developmental trajectories of QOL over time.INTRODUCTION TO BIO STATISTICS 


INTRODUCTION TO BIO STATISTICS Meklelle university
Ėý
This document provides an introduction to biostatistics. It defines key concepts such as statistics, data, variables, populations, and samples. It discusses different types of variables including quantitative and qualitative variables. It also describes different measurement scales including nominal, ordinal, interval and ratio scales. Sources of data and descriptive statistics are introduced. Descriptive statistics help summarize and organize data using tables, graphs, and numerical measures.4T-tests.pptx


4T-tests.pptxraajukumar
Ėý
The document describes three studies that use t-tests for independent samples and one study that uses a t-test for paired samples:
1) A study comparing depression levels between individuals receiving psychotherapy plus drug therapy versus drug therapy alone, with 10 subjects in each group.
2) A study comparing life satisfaction between older and younger adults, with scores from 10 older and 10 younger adults.
3) A study comparing weight between 10 males and 12 females.
4) A study comparing LDL cholesterol levels before and after treatment for a sample of patients, measuring each patient's level at the beginning and end of the observation period.Testing hypothesis (methods of testing the statement of organizations)


Testing hypothesis (methods of testing the statement of organizations)syedahadisa929
Ėý
My ppt is about the testing hypothesis which is used in statistics to check whether the statement of company, organization, or institution is true or falseCHI-SQUARE TEST


CHI-SQUARE TESTNathanBaloloy
Ėý
The chi-square test is used to determine if there is a significant relationship between two categorical variables. There are three main types: test of goodness-of-fit examines the difference between observed and expected frequencies; test of homogeneity compares differences between two or more groups; and test of independence examines the association between two variables. The chi-square test calculates a test statistic and p-value to determine if the null hypothesis that there is no relationship can be rejected.Team27


Team27texasexe
Ėý
This document describes an experiment to determine if caffeine from coffee stunts growth during puberty. The experiment will involve 300 children ages 10-16 from Pennsylvania, split evenly into male and female groups. Each group will be randomly assigned to drink no coffee (control), decaffeinated coffee, or regular caffeinated coffee daily for 10 years. Their height will be measured each year, and any differences in growth across the treatment groups within each gender will indicate whether or not caffeine affects height. Blocking the sample by gender and randomly assigning treatments will help control for other factors and allow conclusions to be drawn about the general population.math homework helpComplete Exercises 11 and 16 inĖýStatistics for.docx


math homework helpComplete Exercises 11 and 16 inĖýStatistics for.docxsalmonpybus
Ėý
math homework help
Complete Exercises 11 and 16 inĖý
Statistics for Health Care Research: A Practical Workbook,Ėý
and submit as directed by the instructor.
In order to receive full credit on calculated answers, please show your work. (Use Word's equation editors, etc., and/or provide a short written description as to how you obtained the final result.)
STATISTICAL TECHNIQUE IN REVIEW
Most studies describe the subjects that comprise the study sample. This description of the sample
is called the sample characteristics which may be presented in a table or the narrative of the
article. The sample characteristics are often presented for each of the groups in a study (i.e. experimental
and control groups). Descriptive statistics are used to generate sample characteristics, and
the type of statistic used depends on the level of measurement of the demographic variables
included in a study (Burns & Grove, 2007). For example, measuring gender produces nominal level
data that can be described using frequencies, percentages, and mode. Measuring educational level
usually produces ordinal data that can be described using frequencies, percentages, mode, median,
and range. Obtaining each subjectâs specific age is an example of ratio data that can be described
using mean, range, and standard deviation. Interval and ratio data are analyzed with the same type
of statistics and are usually referred to as interval/ratio level data in this text.
RESEARCH ARTICLE
Source: Troy, N. W., & Dalgas-Pelish, P. (2003). The effectiveness of a self-care intervention for the
management of postpartum fatigue. Applied Nursing Research, 16(1), 38â45.
Introduction
Troy and Dalgas-Pelish (2003) conducted a quasi-experimental study to determine the effectiveness
of a self-care intervention (Tiredness Management Guide [TMG]) on postpartum fatigue. The study
subjects included 68 primiparous mothers, who were randomly assigned to either the experimental
group (32 subjects) or the control group (36 subjects) using a computer program. The results of
the study indicated that the TMG was effective in reducing levels of morning postpartum fatigue
from the 2nd to 4th weeks postpartum. These researchers recommend that âmothers need to be
informed that they will probably experience postpartum fatigue and be taught to assess and manage
this phenomenonâ (Troy & Dalgas-Pelish, 2003, pp. 44-5).
Relevant Study Results
âA total of 80 women were initially enrolled [in the study] . . . twelve of these women dropped out
of the study resulting in a final sample of 68.â (Troy & Dalgas-Pelish, 2003, p. 39). The researchers
presented the characteristics of their sample in a table format for the experimental and control
groups (see Table 1). The researchers found no significant differences between the control and
experimental groups for any of the demographic or attribute variables.
USING STATISTICS TO DESCRIBE
11 A STUDY SAMPLE
EXERCISE
STUDY QUESTIONS
1. What demographic variables were included in this st.Biostatistics general introduction central tendency


Biostatistics general introduction central tendencyMohmmad Amil Rahman
Ėý
Here are the measures of central tendency and variability I calculated from the given data:
Measures of Central Tendency:
Mean = Sum of all values / Total number of observations
= (60 + 70 + 80 + 90 + 100 + 60 + 70 + 80 + 81 + 79) / 10
= 771 / 10 = 77.1
Measures of Variability:
Range = Highest value - Lowest value
= 100 - 60 = 40
Mean Deviation = Sum of absolute deviations from the mean / Total number of observations
= |60 - 77.1| + |70 - 77.1| + ... + |79 - 77.1| / 10
= 62.1Exercise 1 12 no solution


Exercise 1 12 no solutionForensic Pathology
Ėý
This document contains examples of various statistical analyses exercises involving:
1. Categorizing variables as numerical or categorical.
2. Designing a questionnaire and explaining how to enter data.
3. Different sampling methods like simple random sampling, systematic random sampling, stratified random sampling, and cluster sampling.
4. Presenting data in order arrays, frequency distribution tables, and calculating measures of central tendency and dispersion.
5. Explaining the normal distribution and calculating percentages.
6. Calculating confidence intervals and using the chi-square and t-tests to analyze data.Exercise 1 12 no solution


Exercise 1 12 no solutionForensic Pathology
Ėý
This document contains a series of exercises related to biostatistics and research methods. It includes exercises on categorizing variables, designing a questionnaire, different sampling methods like simple random sampling, systematic random sampling, stratified sampling and cluster sampling. It also includes exercises on ordering and presenting data in frequency distribution tables, calculating measures of central tendency and dispersion, the normal distribution and confidence intervals. The final exercises are on the chi-square test and t-test, including examples of applying these statistical tests to compare groups.Distribution practice


Distribution practiceKen Plummer
Ėý
The document presents 7 practice problems about calculating different statistics from data sets. The problems involve comparing average cyberbullying incidents between grade levels, comparing test score ranges between therapy groups, calculating average blood pressure, examining exam score distributions, determining income variation across a school district, and describing comfort level distributions for different faculty groups. Central tendency, spread, and symmetry are the key statistical concepts addressed.hypothesis testing.pptx


hypothesis testing.pptxRUELLICANTO1
Ėý
The document provides examples of hypothesis testing using z-tests, t-tests, F-tests (ANOVA), and describes how to conduct each test. It includes examples testing hypotheses about means of different groups for variables like exam scores, car crash tests, and sales data. The final example tests whether the monthly sales means are equal to determine which salesman is most likely to be promoted.Lecture 2


Lecture 2PublicHealth9
Ėý
The document provides an overview of key concepts in biostatistics including:
- Common approaches like using common sense, drawing pictures, and being skeptical of small sample sizes and strong conclusions.
- Examples of potential issues like overinterpreting a study with a sample of 10 subjects and reporting 100% improvement.
- Key topics covered include how to think about, visualize, and describe quantitative data through measures of center, spread, and distribution.-Statistical-Analysis hgffghfghfgfgg.pdf


-Statistical-Analysis hgffghfghfgfgg.pdfALRAFIQHANILONG
Ėý
The sampling methods used in each situation are:
1. Cluster sampling (schools were randomly selected and then all students within those schools were included)
2. Simple random sampling (each child had an equal probability of being selected using a random number assignment)
3. Stratified random sampling (the population was divided into subgroups/strata and then a random sample was selected from each)
4. Cluster sampling (sections/clusters were randomly selected and then all students within those sections were included)sta


staAjay Agade
Ėý
This document discusses statistical concepts and tests relevant to epidemiology and biomedical research. It begins by defining key terms like mean, standard deviation, confidence intervals, and p-values. It then discusses different types of data and variables, measures of central tendency, the central limit theorem, and applications of standard error. The document provides examples of choosing appropriate statistical tests for different study designs, including t-tests, ANOVA, chi-square, correlation, and comparing means between two or more groups. Finally, it presents a case study analyzing water-borne disease deaths before and after a water supply installation using appropriate statistical tests.Group aa


Group aatexasexe
Ėý
This document outlines a proposed double-blind experiment to test the effects of coffee consumption on human growth over one year. Six hundred child and young adult volunteers ages 10-21 will be randomly assigned to drink either one cup of coffee or a placebo coffee per day. Their heights will be measured weekly and compared after a year to those in the same age and gender groups to determine if coffee intake impacts growth.QNT 351 Become Exceptional--qnt351.com


QNT 351 Become Exceptional--qnt351.comkopiko140
Ėý
For more course tutorials visit
www.qnt351.com
Q1 The Director of Golf for a local course wants to study the number of rounds played by members on weekdays. He gathered the sample information shown below for 520 rounds.QNT 351 Inspiring Innovation--qnt351.com


QNT 351 Inspiring Innovation--qnt351.comkopiko114
Ėý
For more course tutorials visit
www.qnt351.com
Q1 The Director of Golf for a local course wants to study the number of rounds played by members on weekdays. He gathered the sample information shown below for 520 roundsT Test and ANOVA Presentation_By Limon.pptx


T Test and ANOVA Presentation_By Limon.pptxAkhtaruzzamanlimon1
Ėý
This document discusses various parametric statistical tests including t-tests, ANOVAs, and regression. It provides information on when to use each test and their assumptions. T-tests can be used to compare the means of two samples and determine if any differences are statistically significant. There are one-sample, two-sample independent, and paired t-tests. ANOVA is used to compare the means of three or more samples and can identify which means are significantly different. Factorial and repeated measures ANOVAs are discussed.QNT 351 Redefined Education--qnt351.com


QNT 351 Redefined Education--qnt351.comagathachristie230
Ėý
This document provides a guide for the QNT 351 Final Exam, including 30 multiple choice practice questions covering topics like hypothesis testing, probability, descriptive statistics, sampling, distributions, and confidence intervals. It also provides the scores from previous years' final exams.Reporting a single sample t- test revised


Reporting a single sample t- test revisedAmit Sharma
Ėý
The document provides instructions for reporting the results of a single sample t-test in APA format. It includes an example result comparing the mean IQ scores of persons who eat broccoli regularly (M=120, SD=12.2) to the general population. The t-test found a statistically significant difference between the samples, t(22)=7.86, p=0.000.Epidemiological study design and it's significance


Epidemiological study design and it's significanceGurunathVhanmane1
Ėý
This document provides an overview of parametric statistical tests, including the t-test, ANOVA, Pearson's correlation coefficient, and Z-test. It describes the assumptions, calculations, and procedures for each test. The t-test is used to compare means of small samples and can be used for one sample, two independent samples, or paired samples. ANOVA allows comparison of multiple population means and is used when more than two groups are involved. Pearson's correlation measures the strength of association between two continuous variables. The Z-test, which is used for larger samples, can be applied to compare means or proportions.spss 


spss SHEZA18
Ėý
Its spss notes for the research students that will be highly useful for their understanding of the software.QNT 351 Exceptional Education - snaptutorial.com


QNT 351 Exceptional Education - snaptutorial.comDavisMurphyB22
Ėý
This document provides a guide for the QNT 351 final exam, including 30 multiple choice questions covering topics in descriptive statistics, levels of measurement, measures of central tendency, probability, and probability distributions. It also provides the correct answers to the 30 questions.Reporting a single sample t-test


Reporting a single sample t-testKen Plummer
Ėý
This document provides guidance on reporting the results of a single sample t-test in APA format. It includes templates for describing the test and population in the introduction and reporting the mean, standard deviation, t-value and significance in the results. An example is given of a hypothetical single sample t-test comparing IQ scores of people who eat broccoli regularly to the general population.nonparametrictestresearchmethodology.pdf


nonparametrictestresearchmethodology.pdfarjunnagar13
Ėý
This document provides an overview of non-parametric tests and their applications. It discusses assumptions of parametric vs non-parametric tests and how to test for normality. Commonly used non-parametric tests are described briefly, including Chi-Square, Sign Test, Wilcoxon Signed-Rank Test, Mann-Whitney U Test, Kruskal-Wallis Test, and Spearman Rank-Order Correlation. Examples of applying these tests in SPSS are also mentioned.BEST MACHINE LEARNING INSTITUTE IS DICSITCOURSES


BEST MACHINE LEARNING INSTITUTE IS DICSITCOURSESgs5545791
Ėý
Machine learning is revolutionizing the way technology interacts with data, enabling systems to learn, adapt, and make intelligent decisions without human intervention. It plays a crucial role in various industries, from healthcare and finance to automation and artificial intelligence. If you want to build a successful career in this field, joining the Best Machine Learning Institute In Rohini is the perfect step. With expert-led training, hands-on projects, and industry-recognized certifications, youâll gain the skills needed to thrive in the AI-driven world. If you are interested, then Enroll Fast â limited seats are available!
Leveraging-Virtual-Reality-(VR)-and-Augmented-Reality-(AR)-for-Enhanced-Touri...


Leveraging-Virtual-Reality-(VR)-and-Augmented-Reality-(AR)-for-Enhanced-Touri...Krishna Khanal
Ėý
This chapter proposes to explore the intersection of virtual reality (VR), augmented reality (AR), data analytics, and marketing in the context of the tourism and events industry. As technology continues to advance, organizations within this sector are seeking innovative and transformative ways to engage and attract tourists and event attendees. VR and AR have emerged as powerful tools for creating immersive experiences, while data analytics provides insights into consumer behavior and preferences. This chapter will examine how these technologies can be integrated into marketing strategies to enhance engagement, visitor experiences, and decision- making processes. By discussing real-world case studies, ethical considerations, and future trends, this chapter aims to provide a comprehensive overview of the subject and offer practical insights for professionals and researchers in the field.More Related Content
Similar to stat (20)
Biostatistics general introduction central tendency


Biostatistics general introduction central tendencyMohmmad Amil Rahman
Ėý
Here are the measures of central tendency and variability I calculated from the given data:
Measures of Central Tendency:
Mean = Sum of all values / Total number of observations
= (60 + 70 + 80 + 90 + 100 + 60 + 70 + 80 + 81 + 79) / 10
= 771 / 10 = 77.1
Measures of Variability:
Range = Highest value - Lowest value
= 100 - 60 = 40
Mean Deviation = Sum of absolute deviations from the mean / Total number of observations
= |60 - 77.1| + |70 - 77.1| + ... + |79 - 77.1| / 10
= 62.1Exercise 1 12 no solution


Exercise 1 12 no solutionForensic Pathology
Ėý
This document contains examples of various statistical analyses exercises involving:
1. Categorizing variables as numerical or categorical.
2. Designing a questionnaire and explaining how to enter data.
3. Different sampling methods like simple random sampling, systematic random sampling, stratified random sampling, and cluster sampling.
4. Presenting data in order arrays, frequency distribution tables, and calculating measures of central tendency and dispersion.
5. Explaining the normal distribution and calculating percentages.
6. Calculating confidence intervals and using the chi-square and t-tests to analyze data.Exercise 1 12 no solution


Exercise 1 12 no solutionForensic Pathology
Ėý
This document contains a series of exercises related to biostatistics and research methods. It includes exercises on categorizing variables, designing a questionnaire, different sampling methods like simple random sampling, systematic random sampling, stratified sampling and cluster sampling. It also includes exercises on ordering and presenting data in frequency distribution tables, calculating measures of central tendency and dispersion, the normal distribution and confidence intervals. The final exercises are on the chi-square test and t-test, including examples of applying these statistical tests to compare groups.Distribution practice


Distribution practiceKen Plummer
Ėý
The document presents 7 practice problems about calculating different statistics from data sets. The problems involve comparing average cyberbullying incidents between grade levels, comparing test score ranges between therapy groups, calculating average blood pressure, examining exam score distributions, determining income variation across a school district, and describing comfort level distributions for different faculty groups. Central tendency, spread, and symmetry are the key statistical concepts addressed.hypothesis testing.pptx


hypothesis testing.pptxRUELLICANTO1
Ėý
The document provides examples of hypothesis testing using z-tests, t-tests, F-tests (ANOVA), and describes how to conduct each test. It includes examples testing hypotheses about means of different groups for variables like exam scores, car crash tests, and sales data. The final example tests whether the monthly sales means are equal to determine which salesman is most likely to be promoted.Lecture 2


Lecture 2PublicHealth9
Ėý
The document provides an overview of key concepts in biostatistics including:
- Common approaches like using common sense, drawing pictures, and being skeptical of small sample sizes and strong conclusions.
- Examples of potential issues like overinterpreting a study with a sample of 10 subjects and reporting 100% improvement.
- Key topics covered include how to think about, visualize, and describe quantitative data through measures of center, spread, and distribution.-Statistical-Analysis hgffghfghfgfgg.pdf


-Statistical-Analysis hgffghfghfgfgg.pdfALRAFIQHANILONG
Ėý
The sampling methods used in each situation are:
1. Cluster sampling (schools were randomly selected and then all students within those schools were included)
2. Simple random sampling (each child had an equal probability of being selected using a random number assignment)
3. Stratified random sampling (the population was divided into subgroups/strata and then a random sample was selected from each)
4. Cluster sampling (sections/clusters were randomly selected and then all students within those sections were included)sta


staAjay Agade
Ėý
This document discusses statistical concepts and tests relevant to epidemiology and biomedical research. It begins by defining key terms like mean, standard deviation, confidence intervals, and p-values. It then discusses different types of data and variables, measures of central tendency, the central limit theorem, and applications of standard error. The document provides examples of choosing appropriate statistical tests for different study designs, including t-tests, ANOVA, chi-square, correlation, and comparing means between two or more groups. Finally, it presents a case study analyzing water-borne disease deaths before and after a water supply installation using appropriate statistical tests.Group aa


Group aatexasexe
Ėý
This document outlines a proposed double-blind experiment to test the effects of coffee consumption on human growth over one year. Six hundred child and young adult volunteers ages 10-21 will be randomly assigned to drink either one cup of coffee or a placebo coffee per day. Their heights will be measured weekly and compared after a year to those in the same age and gender groups to determine if coffee intake impacts growth.QNT 351 Become Exceptional--qnt351.com


QNT 351 Become Exceptional--qnt351.comkopiko140
Ėý
For more course tutorials visit
www.qnt351.com
Q1 The Director of Golf for a local course wants to study the number of rounds played by members on weekdays. He gathered the sample information shown below for 520 rounds.QNT 351 Inspiring Innovation--qnt351.com


QNT 351 Inspiring Innovation--qnt351.comkopiko114
Ėý
For more course tutorials visit
www.qnt351.com
Q1 The Director of Golf for a local course wants to study the number of rounds played by members on weekdays. He gathered the sample information shown below for 520 roundsT Test and ANOVA Presentation_By Limon.pptx


T Test and ANOVA Presentation_By Limon.pptxAkhtaruzzamanlimon1
Ėý
This document discusses various parametric statistical tests including t-tests, ANOVAs, and regression. It provides information on when to use each test and their assumptions. T-tests can be used to compare the means of two samples and determine if any differences are statistically significant. There are one-sample, two-sample independent, and paired t-tests. ANOVA is used to compare the means of three or more samples and can identify which means are significantly different. Factorial and repeated measures ANOVAs are discussed.QNT 351 Redefined Education--qnt351.com


QNT 351 Redefined Education--qnt351.comagathachristie230
Ėý
This document provides a guide for the QNT 351 Final Exam, including 30 multiple choice practice questions covering topics like hypothesis testing, probability, descriptive statistics, sampling, distributions, and confidence intervals. It also provides the scores from previous years' final exams.Reporting a single sample t- test revised


Reporting a single sample t- test revisedAmit Sharma
Ėý
The document provides instructions for reporting the results of a single sample t-test in APA format. It includes an example result comparing the mean IQ scores of persons who eat broccoli regularly (M=120, SD=12.2) to the general population. The t-test found a statistically significant difference between the samples, t(22)=7.86, p=0.000.Epidemiological study design and it's significance


Epidemiological study design and it's significanceGurunathVhanmane1
Ėý
This document provides an overview of parametric statistical tests, including the t-test, ANOVA, Pearson's correlation coefficient, and Z-test. It describes the assumptions, calculations, and procedures for each test. The t-test is used to compare means of small samples and can be used for one sample, two independent samples, or paired samples. ANOVA allows comparison of multiple population means and is used when more than two groups are involved. Pearson's correlation measures the strength of association between two continuous variables. The Z-test, which is used for larger samples, can be applied to compare means or proportions.spss 


spss SHEZA18
Ėý
Its spss notes for the research students that will be highly useful for their understanding of the software.QNT 351 Exceptional Education - snaptutorial.com


QNT 351 Exceptional Education - snaptutorial.comDavisMurphyB22
Ėý
This document provides a guide for the QNT 351 final exam, including 30 multiple choice questions covering topics in descriptive statistics, levels of measurement, measures of central tendency, probability, and probability distributions. It also provides the correct answers to the 30 questions.Reporting a single sample t-test


Reporting a single sample t-testKen Plummer
Ėý
This document provides guidance on reporting the results of a single sample t-test in APA format. It includes templates for describing the test and population in the introduction and reporting the mean, standard deviation, t-value and significance in the results. An example is given of a hypothetical single sample t-test comparing IQ scores of people who eat broccoli regularly to the general population.nonparametrictestresearchmethodology.pdf


nonparametrictestresearchmethodology.pdfarjunnagar13
Ėý
This document provides an overview of non-parametric tests and their applications. It discusses assumptions of parametric vs non-parametric tests and how to test for normality. Commonly used non-parametric tests are described briefly, including Chi-Square, Sign Test, Wilcoxon Signed-Rank Test, Mann-Whitney U Test, Kruskal-Wallis Test, and Spearman Rank-Order Correlation. Examples of applying these tests in SPSS are also mentioned.Recently uploaded (20)
BEST MACHINE LEARNING INSTITUTE IS DICSITCOURSES


BEST MACHINE LEARNING INSTITUTE IS DICSITCOURSESgs5545791
Ėý
Machine learning is revolutionizing the way technology interacts with data, enabling systems to learn, adapt, and make intelligent decisions without human intervention. It plays a crucial role in various industries, from healthcare and finance to automation and artificial intelligence. If you want to build a successful career in this field, joining the Best Machine Learning Institute In Rohini is the perfect step. With expert-led training, hands-on projects, and industry-recognized certifications, youâll gain the skills needed to thrive in the AI-driven world. If you are interested, then Enroll Fast â limited seats are available!
Leveraging-Virtual-Reality-(VR)-and-Augmented-Reality-(AR)-for-Enhanced-Touri...


Leveraging-Virtual-Reality-(VR)-and-Augmented-Reality-(AR)-for-Enhanced-Touri...Krishna Khanal
Ėý
This chapter proposes to explore the intersection of virtual reality (VR), augmented reality (AR), data analytics, and marketing in the context of the tourism and events industry. As technology continues to advance, organizations within this sector are seeking innovative and transformative ways to engage and attract tourists and event attendees. VR and AR have emerged as powerful tools for creating immersive experiences, while data analytics provides insights into consumer behavior and preferences. This chapter will examine how these technologies can be integrated into marketing strategies to enhance engagement, visitor experiences, and decision- making processes. By discussing real-world case studies, ethical considerations, and future trends, this chapter aims to provide a comprehensive overview of the subject and offer practical insights for professionals and researchers in the field.ðĨððĄðð__Cubase Pro Crack Full Activativated 2025


ðĨððĄðð__Cubase Pro Crack Full Activativated 2025abrishhayat858
Ėý
ðąðDOWNLOAD LINK ðð https://pcsoftcrack.net/ds/ ðð
Cubase is a professional digital audio workstation (DAW) developed by Steinberg for music production, recording, editing, and mixing. Since its initial release in 1989, Cubase has been widely used by musicians, producers, and sound engineers across various genres. Known for its powerful features, intuitive interface, and high-quality sound engine, Cubase has remained a leading choice for both beginners and professionals in the music industry.
âĄïļ ðCOPY LINK & PASTE INTO GOOGLE ðð https://pcsoftcrack.net/ds/ ðUpdated Willow 2025 Media Deck_280225 Updated.pdf


Updated Willow 2025 Media Deck_280225 Updated.pdftangramcommunication
Ėý
Updated with the edits we last spoke BhavanaPink Yellow Purple Lifestyle Vision Board Scribbles Doodles Whiteboard Pres_2...


Pink Yellow Purple Lifestyle Vision Board Scribbles Doodles Whiteboard Pres_2...jarreldelacruz31
Ėý
Intuitive thinking PRGTUG: Lost in Data? Let's Chart the Way Out!


PRGTUG: Lost in Data? Let's Chart the Way Out!Stanislava Tropcheva
Ėý
Prague Tableau User Group (PRGTUG) Meeting:
Lost in Data?
Let's Chart the Way Out!
27th February 2025
2025 Trends: What Really Works in SEO and Content Marketing


2025 Trends: What Really Works in SEO and Content MarketingDr. Sasidharan Murugan
Ėý
The digital landscape is constantly evolving. Understanding what works in SEO and content marketing today will be critical for success in 2025 and beyond. Let's delve into the key trends shaping the future of online content.Elevate Your Space with Premium Design Services from NInterior Design


Elevate Your Space with Premium Design Services from NInterior DesignNinterior Design
Ėý
Itâs our mission at Ninteriordesign to provide client-focused service through the responsible practice of architecture.Plant Disease Prediction with Image Classification using CNN.pdf


Plant Disease Prediction with Image Classification using CNN.pdfTheekshana Wanniarachchi
Ėý
Plant diseases pose a significant threat to agricultural productivity. Early detection and classification of plant diseases can help mitigate losses. This project focuses on building a Plant Disease Prediction system using Convolutional Neural Networks (CNNs). The system leverages NumPy, TensorFlow, and Streamlit to develop a model and deploy a web-based application. The final model is also containerized using Docker for efficient deployment.International Journal on Cloud Computing: Services and Architecture (IJCCSA)


International Journal on Cloud Computing: Services and Architecture (IJCCSA)ijccsa
Ėý
Cloud computing helps enterprises transform business and technology. Companies have begun to
look for solutions that would help reduce their infrastructure costs and improve profitability. Cloud
computing is becoming a foundation for benefits well beyond IT cost savings. Yet, many business
leaders are concerned about cloud security, privacy, availability, and data protection. To discuss
and address these issues, we invite researches who focus on cloud computing to shed more light
on this emerging field. This peer-reviewed open access Journal aims to bring together researchers
and practitioners in all security aspects of cloud-centric and outsourced computing, including (but
not limited to):When Models Meet Data: From ancient science to todays Artificial Intelligence...


When Models Meet Data: From ancient science to todays Artificial Intelligence...ssuserbbbef4
Ėý
A presentation about Data and Machine LearningNew Income Tax Bill - Capital Gains .pdf


New Income Tax Bill - Capital Gains .pdfHarshilShah134194
Ėý
The #IncomeTaxBill 2025 simplifies capital gains taxation by removing exemptions, restricting tax benefits to long-term gains, and limiting indexation. Here is our detailed analysis of the proposed changes.
HIRE MUYERN TRUST HACKER FOR AUTHENTIC CYBER SERVICES


HIRE MUYERN TRUST HACKER FOR AUTHENTIC CYBER SERVICESanastasiapenova16
Ėý
Itâs hard to imagine the frustration and helplessness a 65-year-old man with limited computer skills must feel when facing the aftermath of a crypto scam. Recovering a hacked trading wallet can feel like an absolute nightmare, especially when every step seems to lead you into an endless loop of failed solutions. Thatâs exactly what I went through over the past four weeks. After my trading wallet was compromised, the hacker changed my email address, password, and even removed my phone number from the account. For someone with little technical expertise, this was not just overwhelming, it was a disaster. Every suggested solution I came across in online help centers was either too complex or simply ineffective. I tried countless links, tutorials, and forums, only to find myself stuck, not even close to reclaiming my stolen crypto. In a last-ditch effort, I turned to Google and stumbled upon a review about MUYERN TRUST HACKER. At first, I was skeptical, like anyone would be in my position. But the glowing reviews, especially from people with similar experiences, gave me a glimmer of hope. Despite my doubts, I decided to reach out to them for assistance.The team at MUYERN TRUST HACKER immediately put me at ease. They were professional, understanding, and reassuring. Unlike other services that felt impersonal or automated, they took the time to walk me through every step of the recovery process. The fact that they were willing to schedule a 25-minute session to help me properly secure my account after recovery was invaluable. Today, Iâm grateful to say that my stolen crypto has been fully recovered, and my account is secure again. This experience has taught me that sometimes, even when you feel like all hope is lost, thereâs always a way to fight back. If youâre going through something similar, donât give up. Reach out to MUYERN TRUST HACKER. Even if youâve already tried everything, their expertise and persistence might just be the solution you need.I wholeheartedly recommend MUYERN TRUST HACKER to anyone facing the same situation. Whether youâre a novice or experienced in technology, theyâre the right team to trust when it comes to recovering stolen crypto or securing your accounts. Donât hesitate to contact them, it's worth it. Reach out to them on telegram at muyerntrusthackertech or web: ht tps :// muyerntrusthacker . o r g for faster response.Cost sheet. with basics and formats of sheet


Cost sheet. with basics and formats of sheetsupreetk82004
Ėý
Cost sheet. with basics and formats of sheetCost sheet. with basics and formats of sheetCost sheet. with basics and formats of sheetCost sheet. with basics and formats of sheetCost sheet. with basics and formats of sheetCost sheet. with basics and formats of sheetCost sheet. with basics and formats of sheetCost sheet. with basics and formats of sheetCost sheet. with basics and formats of sheetCost sheet. with basics and formats of sheetCost sheet. with basics and formats of sheetCost sheet. with basics and formats of sheetCost sheet. with basics and formats of sheetCost sheet. with basics and formats of sheetCost sheet. with basics and formats of sheetMTC Supply Chain Management Strategy.pptx


MTC Supply Chain Management Strategy.pptxRakshit Porwal
Ėý
Strategic Cost Reduction in Medical Devices Supply Chain: Achieving Sustainable Profitability9th Edition of International Research Awards


9th Edition of International Research Awardssciencereviewerview
Ėý
9th Edition of International Research Awards |28-29 March 2025 | San Francisco, United States
The International Research Awards recognize exceptional research contributions, innovation, and excellence across various fields. This prestigious award honors outstanding researchers, scientists, and scholars who have made significant impacts in their respective disciplines, fostering a culture of innovation and discovery.stat
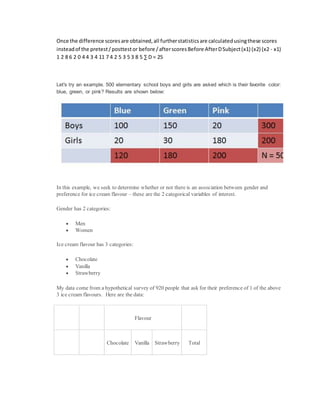
- 1. Once the difference scoresare obtained,all furtherstatisticsare calculatedusingthese scores insteadof the pretest/posttestor before /afterscoresBefore AfterDSubject(x1) (x2) (x2 - x1) 1 2 8 6 2 0 4 4 3 4 11 7 4 2 5 3 5 3 8 5 â D = 25 Let's try an example. 500 elementary school boys and girls are asked which is their favorite color: blue, green, or pink? Results are shown below: In this example, we seek to determine whether or not there is an association between gender and preference for ice cream flavour â these are the 2 categorical variables of interest. Gender has 2 categories: ï· Men ï· Women Ice cream flavour has 3 categories: ï· Chocolate ï· Vanilla ï· Strawberry My data come from a hypothetical survey of 920 people that ask for their preference of 1 of the above 3 ice cream flavours. Here are the data: Flavour Chocolate Vanilla Strawberry Total
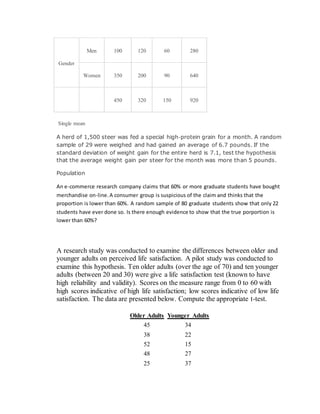
- 2. Gender Men 100 120 60 280 Women 350 200 90 640 450 320 150 920 Single mean A herd of 1,500 steer was fed a special highâprotein grain for a month. A random sample of 29 were weighed and had gained an average of 6.7 pounds. If the standard deviation of weight gain for the entire herd is 7.1, test the hypothesis that the average weight gain per steer for the month was more than 5 pounds. Population An e-commerce research company claims that 60% or more graduate students have bought merchandise on-line.A consumer group is suspicious of the claim and thinks that the proportion is lower than 60%. A random sample of 80 graduate students show that only 22 students have ever done so. Is there enough evidence to show that the true porportion is lower than 60%? A research study was conducted to examine the differences between older and younger adults on perceived life satisfaction. A pilot study was conducted to examine this hypothesis. Ten older adults (over the age of 70) and ten younger adults (between 20 and 30) were give a life satisfaction test (known to have high reliability and validity). Scores on the measure range from 0 to 60 with high scores indicative of high life satisfaction; low scores indicative of low life satisfaction. The data are presented below. Compute the appropriate t-test. Older Adults Younger Adults 45 34 38 22 52 15 48 27 25 37
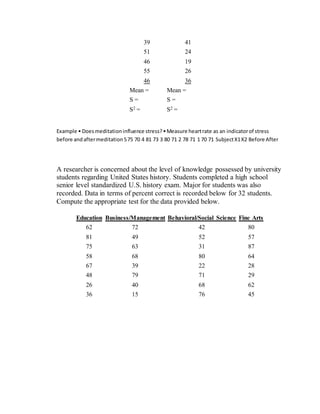
- 3. 39 41 51 24 46 19 55 26 46 36 Mean = Mean = S = S = S2 = S2 = Example âĒ Doesmeditationinfluence stress?âĒMeasure heartrate as an indicatorof stress before andaftermeditation575 70 4 81 73 3 80 71 2 78 71 1 70 71 SubjectX1X2 Before After A researcher is concerned about the level of knowledge possessed by university students regarding United States history. Students completed a high school senior level standardized U.S. history exam. Major for students was also recorded. Data in terms of percent correct is recorded below for 32 students. Compute the appropriate test for the data provided below. Education Business/Management Behavioral/Social Science Fine Arts 62 72 42 80 81 49 52 57 75 63 31 87 58 68 80 64 67 39 22 28 48 79 71 29 26 40 68 62 36 15 76 45


