State Transitions
- 1. Detecting State Transitions in a Stock Market with Many Agents Eric Van Horenbeeck PhD CNTS, University of Antwerp
- 2. Detecting State Transitions in a Stock Market with Many Agents Main thesis: Decisions based on state transitions perform better than decisions based on models of complex behavior A transition occurs when an interactive system is triggered into an alternate state of organization
- 3. Detecting State Transitions in a Stock Market with Many Agents Outline 1. Example 2. A Stock Market is a Complex Environment 3. Self-organization 4. Swarming and Schooling 5. Detecting State Transitions 6. Results 7. Summary 8. Future Work
- 4. 1. Example 2. A Stock Market is a Complex Environment 3. Self-organization 4. Swarming and Schooling 5. Detecting State Transitions 6. Results 7. Summary 8. Future Work
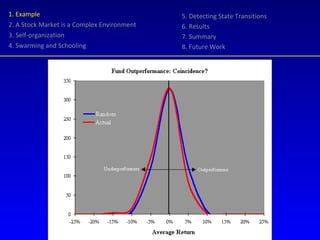
- 5. 1. Example 2. A Stock Market is a Complex Environment 3. Self-organization 4. Swarming and Schooling 5. Detecting State Transitions 6. Results 7. Summary 8. Future Work Red line: US funds with a range of annual return for ten years ending December 2000. Blue line: returns from random chance The red and blue lines are on top of each other indicating that the number of above average funds is no different than if fund returns were based entirely on luck. The number of fund managers with above-average returns over the last ten years is no different than would be by chance
- 6. 1. Example 2. A Stock Market is a Complex Environment 3. Self-organization 4. Swarming and Schooling 5. Detecting State Transitions 6. Results 7. Summary 8. Future Work
- 7. 1. Example 2. A Stock Market is a Complex Environment 3. Self-organization 4. Swarming and Schooling 5. Detecting State Transitions 6. Results 7. Summary 8. Future Work Technical traders assume that prices follow a pattern Fundamental analysts assume prices respond to underlying economic realities Random Walk Theory and Efficient Market Hypothesis hold that the best bet for tomorrowŌĆÖs stock price is its value today But
- 8. 1. Example 2. A Stock Market is a Complex Environment 3. Self-organization 4. Swarming and Schooling 5. Detecting State Transitions 6. Results 7. Summary 8. Future Work Long term feedback effects Erratic behavior under certain conditions Fractal structure Sensitive on initial conditions Trading behavior is neither purely rational nor random
- 9. 1. Example 2. A Stock Market is a Complex Environment 3. Self-organization 4. Swarming and Schooling 5. Detecting State Transitions 6. Results 7. Summary 8. Future Work Distances between intraday prices are small relative to the length of the path covered, i.e. trade prices are clustered Stock market as a system shows regularity in spite of unpredictable interaction between its agents We have biological and physical models that exhibit similar behavior: ants, fish, plasma oscillations ...
- 10. 1. Example 2. A Stock Market is a Complex Environment 3. Self-organization 4. Swarming and Schooling 5. Detecting State Transitions 6. Results 7. Summary 8. Future Work From biological models * we learn: Strong relation exists between the constant J, coupling individual members and the strength of noise ’üź In the swarming phase where J < 5 ’üó ’üź , the center of the school hardly moves, whereas if J > 5 ’üó ’üź the fish form a tighter group with a rectilinear movement ’üó characterizes the non-linearity of the system, ’üó -1/2 is the steady swimming speed of fish At J ’üó -1/2 = 5 ’üź / ’üó -1/2 the schooling structure is self-organizing * Hiro-Sato Niwa (1994) Self-organizing Dynamic Model of Fish Schooling. In Journal of Theoretical Biology , 171, p. 23 ŌĆō 136
- 11. 1. Example 2. A Stock Market is a Complex Environment 3. Self-organization 4. Swarming and Schooling 5. Detecting State Transitions 6. Results 7. Summary 8. Future Work ’üź / ’üó -1/2 stands for the magnitude of random movement J where ’üó -1/2 indicates the mean strength of influence on one individual by the other individuals as a group A transition occurs when the system is no longer driven by the average behavior of individuals. At the sudden transition between incoherent and coherent interaction, the school takes over and the individual becomes a follower.
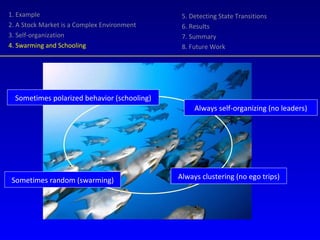
- 12. Always clustering (no ego trips) Always self-organizing (no leaders) Sometimes polarized behavior (schooling) Sometimes random (swarming) 1. Example 2. A Stock Market is a Complex Environment 3. Self-organization 4. Swarming and Schooling 5. Detecting State Transitions 6. Results 7. Summary 8. Future Work
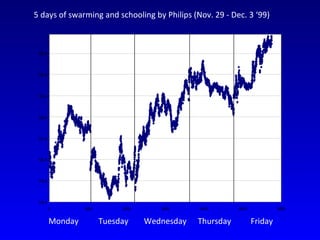
- 13. Monday Tuesday Wednesday Thursday Friday 5 days of swarming and schooling by Philips (Nov. 29 - Dec. 3 ŌĆś99)
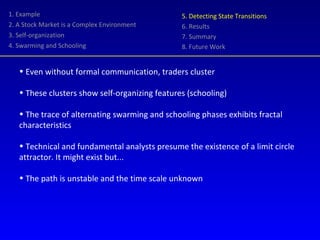
- 14. 1. Example 2. A Stock Market is a Complex Environment 3. Self-organization 4. Swarming and Schooling 5. Detecting State Transitions 6. Results 7. Summary 8. Future Work Even without formal communication, traders cluster These clusters show self-organizing features (schooling) The trace of alternating swarming and schooling phases exhibits fractal characteristics Technical and fundamental analysts presume the existence of a limit circle attractor. It might exist but... The path is unstable and the time scale unknown
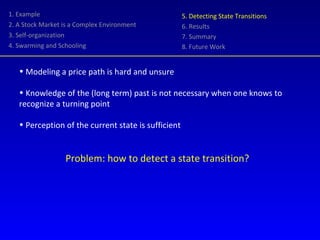
- 15. 1. Example 2. A Stock Market is a Complex Environment 3. Self-organization 4. Swarming and Schooling 5. Detecting State Transitions 6. Results 7. Summary 8. Future Work Modeling a price path is hard and unsure Knowledge of the (long term) past is not necessary when one knows to recognize a turning point Perception of the current state is sufficient Problem: how to detect a state transition?
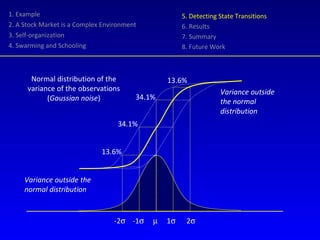
- 16. 1. Example 2. A Stock Market is a Complex Environment 3. Self-organization 4. Swarming and Schooling 5. Detecting State Transitions 6. Results 7. Summary 8. Future Work -2 ’ü│ -1 ’ü│ ’üŁ 1 ’ü│ 2 ’ü│ 13.6% 13.6% 34.1% 34.1% Normal distribution of the variance of the observations ( Gaussian noise ) Variance outside the normal distribution Variance outside the normal distribution
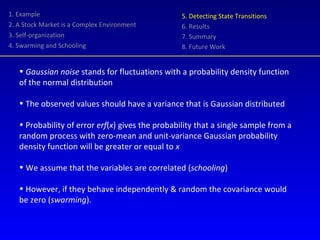
- 17. 1. Example 2. A Stock Market is a Complex Environment 3. Self-organization 4. Swarming and Schooling 5. Detecting State Transitions 6. Results 7. Summary 8. Future Work Gaussian noise stands for fluctuations with a probability density function of the normal distribution The observed values should have a variance that is Gaussian distributed Probability of error erf ( x ) gives the probability that a single sample from a random process with zero-mean and unit-variance Gaussian probability density function will be greater or equal to x We assume that the variables are correlated ( schooling ) However, if they behave independently & random the covariance would be zero ( swarming ).
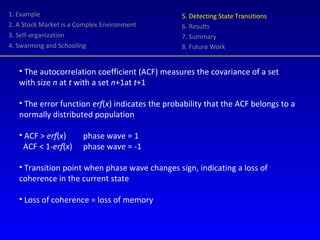
- 18. 1. Example 2. A Stock Market is a Complex Environment 3. Self-organization 4. Swarming and Schooling 5. Detecting State Transitions 6. Results 7. Summary 8. Future Work The autocorrelation coefficient (ACF) measures the covariance of a set with size n at t with a set n +1at t +1 The error function erf ( x ) indicates the probability that the ACF belongs to a normally distributed population ACF > erf ( x ) phase wave = 1 ACF < 1- erf ( x ) phase wave = -1 Transition point when phase wave changes sign, indicating a loss of coherence in the current state Loss of coherence = loss of memory
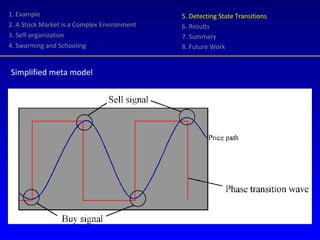
- 19. 1. Example 2. A Stock Market is a Complex Environment 3. Self-organization 4. Swarming and Schooling 5. Detecting State Transitions 6. Results 7. Summary 8. Future Work Simplified meta model
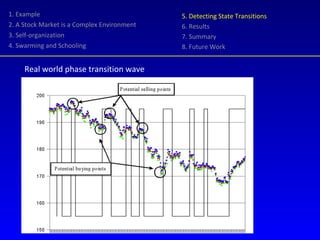
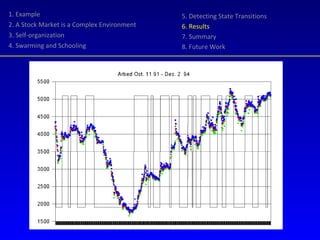
- 20. 1. Example 2. A Stock Market is a Complex Environment 3. Self-organization 4. Swarming and Schooling 5. Detecting State Transitions 6. Results 7. Summary 8. Future Work Real world phase transition wave
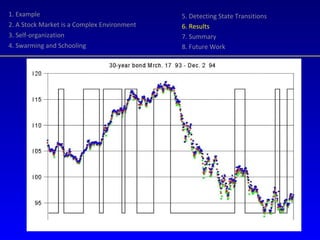
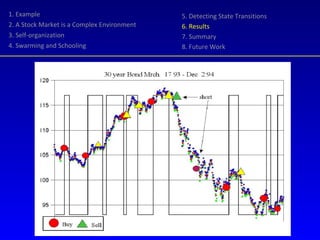
- 21. 1. Example 2. A Stock Market is a Complex Environment 3. Self-organization 4. Swarming and Schooling 5. Detecting State Transitions 6. Results 7. Summary 8. Future Work Random Harvester is a trading agent that uses phase transition signals to buy and sell stock Application of business rules: transaction costs, expiration of contracts... Tested on real (historical) data, fed one by one without recalculation of past positions
- 22. 1. Example 2. A Stock Market is a Complex Environment 3. Self-organization 4. Swarming and Schooling 5. Detecting State Transitions 6. Results 7. Summary 8. Future Work
- 23. 1. Example 2. A Stock Market is a Complex Environment 3. Self-organization 4. Swarming and Schooling 5. Detecting State Transitions 6. Results 7. Summary 8. Future Work
- 24. 1. Example 2. A Stock Market is a Complex Environment 3. Self-organization 4. Swarming and Schooling 5. Detecting State Transitions 6. Results 7. Summary 8. Future Work
- 25. 1. Example 2. A Stock Market is a Complex Environment 3. Self-organization 4. Swarming and Schooling 5. Detecting State Transitions 6. Results 7. Summary 8. Future Work
- 26. 5. Detecting State Transitions 6. Results 7. Summary 8. Future Work 1. Example 2. A Stock Market is a Complex Environment 3. Self-organization 4. Swarming and Schooling
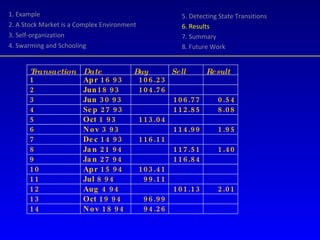
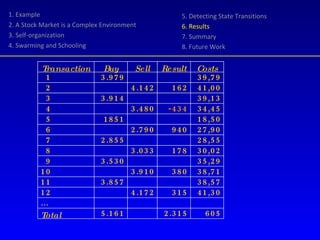
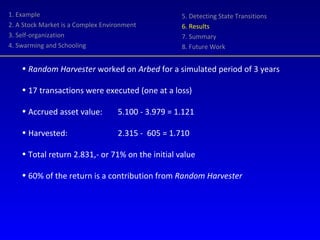
- 27. Random Harvester worked on Arbed for a simulated period of 3 years 17 transactions were executed (one at a loss) Accrued asset value: 5.100 - 3.979 = 1.121 Harvested: 2.315 - 605 = 1.710 Total return 2.831,- or 71% on the initial value 60% of the return is a contribution from Random Harvester 1. Example 2. A Stock Market is a Complex Environment 3. Self-organization 4. Swarming and Schooling 5. Detecting State Transitions 6. Results 7. Summary 8. Future Work
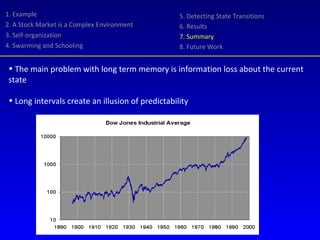
- 28. 1. Example 2. A Stock Market is a Complex Environment 3. Self-organization 4. Swarming and Schooling 5. Detecting State Transitions 6. Results 7. Summary 8. Future Work The main problem with long term memory is information loss about the current state Long intervals create an illusion of predictability
- 29. 1. Example 2. A Stock Market is a Complex Environment 3. Self-organization 4. Swarming and Schooling 5. Detecting State Transitions 6. Results 7. Summary 8. Future Work Action is induced by a phase transition (coherence breaking) Perceiving signals of imminent change is necessary to adapt behavior according to the appropriate business rules No need to model the full path Strong preliminary results
- 30. 1. Example 2. A Stock Market is a Complex Environment 3. Self-organization 4. Swarming and Schooling 5. Detecting State Transitions 6. Results 7. Summary 8. Future Work Improve direction detection after a transition with vector analysis of local clusters Comparing with other trading agents under similar conditions Generalize use to class of decision problems based on the current state in a dynamic environment
- 31. ... for the gods perceive future things, ordinary men things in the present, but wise men perceive things about to happen ... Philostratus, Life of Apollonius of Tyana , VIII, 7 * * Quoted in Taleb, Nassim N. (2001). Fooled By Randomness. The Hidden Role of Chance in the Markets and in Life. New York, NY: Texere, p. 56
- 32. References W. B . Arthur, S. N. Durlauf and D . A. Lane, eds.1997. The Economy as an Evolving Complex System II . Addison-Wesley. Reading, Mass. P. Bak, M Paczuski and M. Shubik. 1996. Price Variations in a Stock Market with Many Agents. Working Paper for the Santa F├® Institute Economics Research Program, submitted to the Journal of Mathematical Economics . P. De Grauwe, H. Dewachter and M. Embrechts. 1993. Exchange Rate Theory , Blackwell, Oxford. J. L. Deneubourg, S. Goss, N. R. Franks, A.Sendova-Franks, C. Detrain and L. Chretien.1990. The Dynamics of Collective Sorting:Robot-like Ants and Ant-like Robots. In J-A Meyer and S. Wilson eds, Simulation of Adaptive Behaviour: from Animals to Animats , MIT Press, Cambridge, Mass. E.F. Fama and K.R. French. 1992. The Cross-Section of Expected Stock Returns. In the Journal of Finance , 2. K..R. French and R. Roll. 1986. Stock Return Variances, The Arrival of Information and the Reaction of Traders. In Journal of Financial Economics , 17. L. Harris. 1986. A Transaction Data Study of Weekly and Intradaily Patterns in Stock Returns. In Journal of Financial Economics , 16. A. W. Lo and A. C. MacKinlay 1999. A Non-Random Walk Down Wall Street . Princeton University Press, Princeton. B. Mandelbrot. 1966. Forecast of future prices, unbiased markets and martingale models. In The Journal of Business of the University of Chicago ,39 . B. Mandelbrot. 1998. Fractals and Scaling in Finance: Discontinuity, Concentration, Risk . Springer-verlag, New York. R.N. Mantegna and H.E. Stanley. 1995. Scaling Behavior in the Dynamics of an Economic Index. In Nature , 376. Hiro-Sato Niwa. 1994. Self-organizing Dynamic Model of Fish Schooling. In Journal of Theoretical Biology , 171. E. P. Peters. 1991. Chaos and Order in Capital Markets . J. Wiley and Son, New York. R. J. Schiller. 1984. Stock Prices and Social Dynamics In The Brookings Papers on Economic Activity , 2.