Statiska
Download as ppt, pdf1 like790 views

The document discusses statistics as the study of collecting, organizing, analyzing, interpreting, and presenting data. It involves planning data collection through surveys and experiments. A statistician is skilled in statistical analysis through experience in various fields. Statistics refers to the scientific discipline singularly, while statistic refers to a quantity calculated from data.

Statiska
- 2. StatisticsÃ˝is the study of the collection, organization, analysis, interpretation, and presentation ofÃ˝data . It deals with all aspects of this, including the planning of data collection in terms of the design ofÃ˝surveysÃ˝andÃ˝experiments. AÃ˝statisticianÃ˝is someone who is particularly well versed in the ways of thinking necessary for the successful application of statistical analysis. Such people have often gained this experience through working in any of aÃ˝wide number of fields. There is also a discipline calledÃ˝mathematical statisticsÃ˝that studies statistics mathematically. The wordÃ˝statistics, when referring to the scientific discipline, is singular, as in "Statistics is an art.Ã˝This should not be confused with the wordÃ˝statistic, referring to a quantity (such asÃ˝meanÃ˝ormedian) calculated from a set of data,Ã˝whose plural isÃ˝statisticsÃ˝("this statistic seems wrong" or "these statistics are misleading").
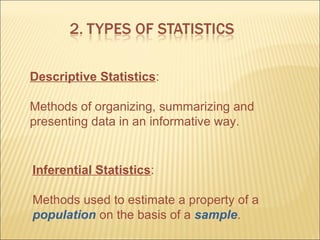
- 3. Descriptive Statistics: Methods of organizing, summarizing and presenting data in an informative way. Inferential Statistics: Methods used to estimate a property of a population on the basis of a sample.
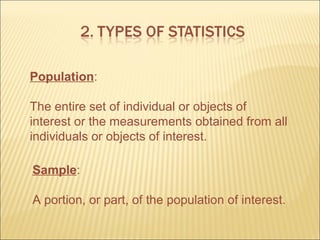
- 4. Population: The entire set of individual or objects of interest or the measurements obtained from all individuals or objects of interest. Sample: A portion, or part, of the population of interest.
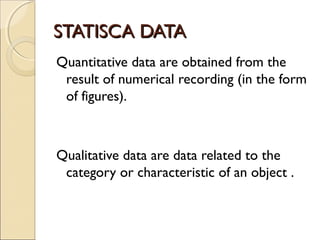
- 5. STATISCA DATA Quantitative data are obtained from the result of numerical recording (in the form of figures). Qualitative data are data related to the category or characteristic of an object .
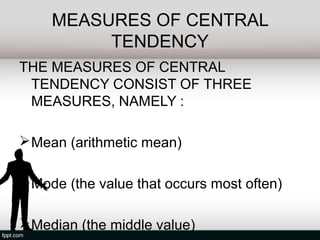
- 6. MEASURES OF CENTRAL TENDENCY THE MEASURES OF CENTRAL TENDENCY CONSIST OF THREE MEASURES, NAMELY : ÔÉò Mean (arithmetic mean) ÔÉò Mode (the value that occurs most often) ÔÉò Median (the middle value)
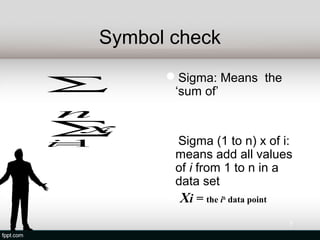
- 7. Symbol check Sigma: Means the ∑ ‘sum of’ n ∑xi Sigma (1 to n) x of i: = i 1 means add all values of i from 1 to n in a data set Xi = the ith data point 7
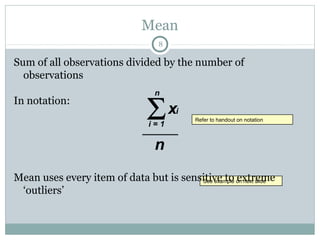
- 8. Mean 8 Sum of all observations divided by the number of observations Σx n In notation: i Refer to handout on notation i=1 Refer to handout on notation n Mean uses every item of data but is sensitive to on next slide See example extreme See example on next slide ‘outliers’
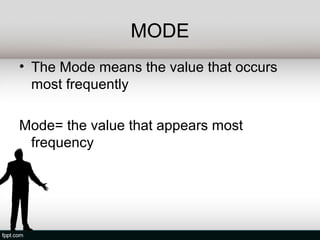
- 9. MODE • The Mode means the value that occurs most frequently Mode= the value that appears most frequency
- 10. MEDIAN • The median is a measure of central tendency used to analyze data.when the collected data are ordered,the data value which lies in the middle (the middle value of data)is called the median
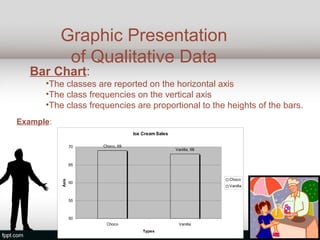
- 11. Graphic Presentation of Qualitative Data Bar Chart: •The classes are reported on the horizontal axis •The class frequencies on the vertical axis •The class frequencies are proportional to the heights of the bars. Example: Ice cream 20 vendors Ice Cream Sales 70 Choco, 69 Vanilla, 68 65 Choco Axis 60 Vanilla 55 50 Choco Vanilla Types
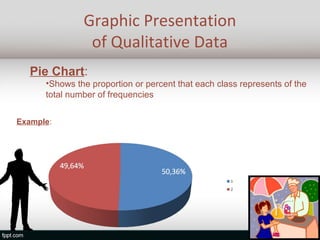
- 12. Graphic Presentation of Qualitative Data Pie Chart: •Shows the proportion or percent that each class represents of the total number of frequencies Example: Ice cream 20 vendors
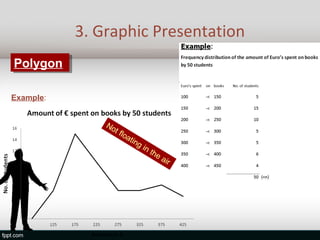
- 14. 3. Graphic Presentation Polygon Polygon Example: No t fl oa tin gi nt he air
- 15. OUR SURVEY In class 8B there are 23 students,after our survey in class 8B get data about: • Most subjects preferred • Most subject not preferred • Opinion about math
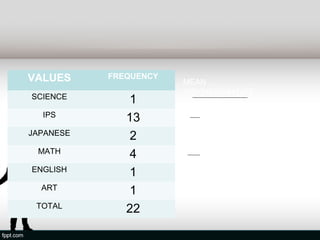
- 16. VALUES FREQUENCY MEAN 1x3+1x2+1x4+1x13 SCIENCE 1 6 22 IPS 13 6 =3.66 JAPANESE 2 MEDIAN 22 MATH 4 2 =11 (IPS) ENGLISH 1 ART 1 TOTAL 22
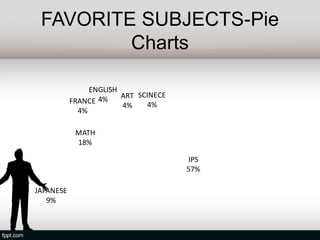
- 17. FAVORITE SUBJECTS-Pie Charts ENGLISH 4% ART SCINECE FRANCE 4% 4% 4% MATH 18% IPS 57% JAPANESE 9%
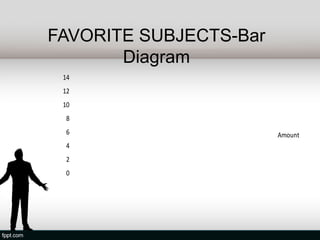
- 18. FAVORITE SUBJECTS-Bar Diagram 14 12 10 8 6 Amount 4 2 0
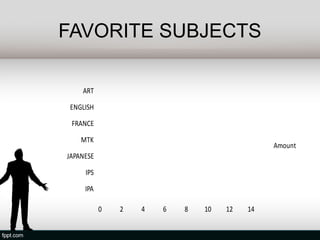
- 19. FAVORITE SUBJECTS ART ENGLISH FRANCE MTK Amount JAPANESE IPS IPA 0 2 4 6 8 10 12 14
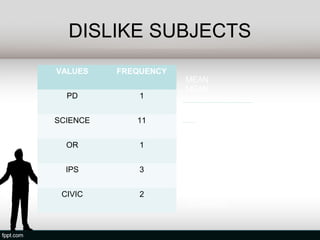
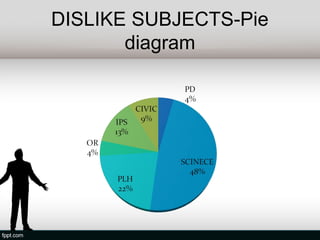
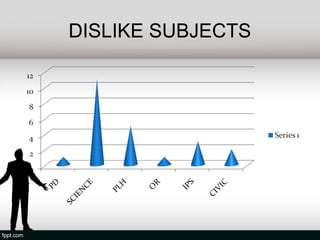
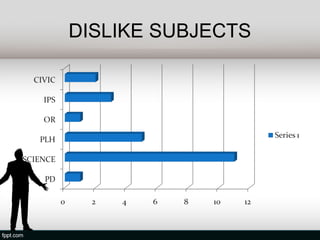
- 20. DISLIKE SUBJECTS VALUES FREQUENCY MEAN MEAN PD 1 1x11+1x3+1x2 x2+1 6 SCIENCE 11 22 6 =3.66 OR 1 MEDIAN 22 IPS 3 2 =11 (SCIENCE) CIVIC 2 MODE (SCIENCE)
- 21. DISLIKE SUBJECTS-Pie diagram
- 22. DISLIKE SUBJECTS
- 23. DISLIKE SUBJECTS
- 24. EXERCISE
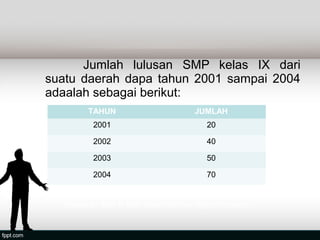
- 26. Jumlah lulusan SMP kelas IX dari suatu daerah dapa tahun 2001 sampai 2004 adaalah sebagai berikut: TAHUN JUMLAH 2001 20 2002 40 2003 50 2004 70 Nyatakan data di atas dalam bentuk diagram batang
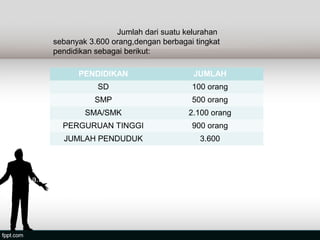
- 27. Jumlah dari suatu kelurahan sebanyak 3.600 orang,dengan berbagai tingkat pendidikan sebagai berikut: PENDIDIKAN JUMLAH SD 100 orang SMP 500 orang SMA/SMK 2.100 orang PERGURUAN TINGGI 900 orang JUMLAH PENDUDUK 3.600 Jika Data tersebut di buat diagram lingkaranmanak tentukan, a.Besarnya sudut sektor lingkaran untuk pendidikan SD,SMP,SMA/SMK dan Perguruan Tinggi b.Diagram lingkaran
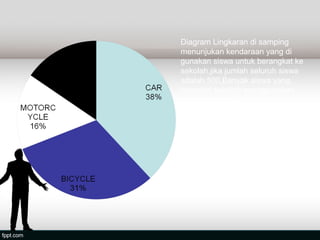
- 28. Diagram Lingkaran di samping menunjukan kendaraan yang di gunakan siswa untuk berangkat ke sekolah,jika jumlah seluruh siswa adalah 500,Banyak siswa yang berankat sekolah menggunakan sepeda adalah ... A.123 B.100 C.321 D.120