Statistic assignment (muti rara zara citra)
Download as ppt, pdf3 likes689 views

Statistics is the science of collecting, organizing, and analyzing data to draw conclusions. It involves descriptive statistics like summarizing data, and inferential statistics like making conclusions from the data. There are two main types of data: quantitative data obtained from measurements, and qualitative data related to characteristics. Common measures of central tendency analyzed in statistics include the mean, median, and mode. The document provides examples of calculating these measures from sample data on daily pocket money and study time collected from a class of 30 students.
1 of 15
Downloaded 12 times


Ad
Recommended
Measures of central tendency mean
Measures of central tendency meansuncil0071
╠²
The document discusses measures of central tendency, specifically the mean. It defines the mean as the average of all values in a data set, found by adding all values and dividing by the total number of data points. The mean represents the balance point of a distribution and feels like the center because it is the value where the data balances on either side when represented visually in a histogram. The mean is unique in that a data set only has one mean, and it is influenced by all observations in the data set.Measure of Central Tendency
Measure of Central TendencyAurus Network
╠²
Central tendency refers to the typical or average value of a data set and can be measured using the mean, median, or mode. The mean is calculated by adding all values and dividing by the number of values, the median is the middle value of a data set arranged in order, and the mode is the most frequently occurring value.Lesson Plan- Measures of Central tendency of Data
Lesson Plan- Measures of Central tendency of DataElton John Embodo
╠²
The document provides instructions for teaching students about measures of central tendency (mean, median, mode) using ungrouped data. It outlines objectives, subject matter, materials, and procedures for the lesson. The teacher's activity is to define and provide examples to calculate the mean, median, and mode. The students' activity is to practice calculating these measures and describing data sets in terms of them. The lesson concludes with an assignment for students to find the mean, median, and mode of additional data sets.Introduction to statistics
Introduction to statisticsAmira Talic
╠²
This document provides an introduction to statistics. It defines statistics as the science of data that involves collecting, classifying, summarizing, organizing, and interpreting numerical information. It outlines key terms such as data, population, sample, parameter, and statistic. It describes different types of variables like independent and dependent variables. It discusses descriptive statistics, inferential statistics, and predictive modeling. Finally, it explains important concepts like measures of central tendency, measures of variation, and statistical distributions like the normal distribution.Measures Of Central Tendency
Measures Of Central Tendencyjchancew
╠²
This document defines and provides examples of measures of central tendency including the mean, median, and mode. It also discusses the range. The mean is the average and is calculated by summing all values and dividing by the total number. The median is the middle value when data is arranged from lowest to highest. The mode is the most frequently occurring value. The range is the difference between the highest and lowest values. Examples of how these are used include calculating the average age or income and determining vaccination guidelines based on age range.Introduction to statistics
Introduction to statisticsKapil Dev Ghante
╠²
This document provides an introduction to descriptive statistics and measures of central tendency, including the mean, median, and mode. It discusses how the mean can be impacted by outliers, while the median is not. The standard deviation and variance are introduced as measures of dispersion that quantify how much values vary from the mean or from each other. Finally, the document discusses different ways of organizing and graphing data, including histograms, pie charts, line graphs, and scatter plots.2 biostatistics presenting data
2 biostatistics presenting dataDr. Nazar Jaf
╠²
This document discusses organizing and presenting data through descriptive statistics. It describes various types of descriptive statistics including measures to condense data like frequency distributions and graphic presentations. It then provides examples and steps for creating frequency distribution tables and different types of graphs like bar charts, histograms, line graphs, scatterplots and pie charts to summarize both qualitative and quantitative data.Measures of central tendency dispersion
Measures of central tendency dispersionAbhinav yadav
╠²
This document discusses measures of central tendency (mean, median, mode) and dispersion (range, standard deviation). It explains how to calculate each measure and states their strengths and weaknesses. For example, the mean is more sensitive than the median but can be skewed by outliers, while the median is not affected by extremes but is less sensitive. Standard deviation measures the average distance from the mean and helps determine what percentage of data falls within certain ranges. The document provides examples to illustrate these concepts.3 measures of central dendency
3 measures of central dendencyDr. Nazar Jaf
╠²
This document discusses measures of central tendency, which are summary measures that describe the middle or center of a data set with a single value. The three main measures are the mode, median, and mean. The mode is the most frequently occurring value, the median is the middle value when data are arranged in order, and the mean is the average calculated by summing all values and dividing by the total number of data points. The appropriate measure depends on the shape and type of data. Symmetrical distributions have equal mode, median and mean, while skewed distributions cause the mean to be "pulled" away from the middle.Data Display and Summary
Data Display and SummaryDrZahid Khan
╠²
This document provides an overview of key concepts in biostatistics including data display and summary. It defines different types of data, variables, and statistical measures. Descriptive statistics like mean, median and mode are used to summarize central tendencies, while measures like range, variance and standard deviation describe data dispersion. Various graphs including histograms, boxplots and stem-and-leaf plots are discussed as tools for data visualization.Business statistics
Business statisticsRavi Prakash
╠²
This document discusses measures of central tendency and dispersion in statistics. It defines central tendency as a single value that describes the center of a data distribution. Common measures include the mean, median, and mode. The mean is the average value calculated by adding all values and dividing by the total number. The median is the middle value when data is ordered from lowest to highest. The mode is the most frequent value. Dispersion measures the spread of data and includes the range, mean deviation, standard deviation, and variance. Standard deviation summarizes how far data points are from the mean. Variance is the square of the standard deviation. The document provides examples of calculating these measures and their characteristics and uses.Central tendency
Central tendency Sudipto Krishna Dutta
╠²
This document discusses measures of central tendency. It defines central tendency as a statistical measure that identifies a single value that best represents an entire data set. The three main measures are the mean, median, and mode.
The mean is the average value, calculated by summing all values and dividing by the total number. The median is the middle value when data is arranged in order. The mode is the most frequently occurring value.
The document provides examples and formulas to calculate each measure. It also discusses advantages and disadvantages of each, and gives examples of how they are used in daily life situations like measuring student test scores or transportation usage.Measures of central tendency ict integration
Measures of central tendency ict integrationRichard Paulino
╠²
The document discusses different measures of central tendency including the mean, median, and mode. It provides definitions and formulas for calculating each. The mean is the average and is calculated by adding all values and dividing by the total count. The median is the middle value when data is arranged in order. The mode is the most frequently occurring value. Examples are given to demonstrate calculating and interpreting each measure of central tendency.Statstics in nursing
Statstics in nursing Monika Devi NR
╠²
The document provides an overview of statistics as used in nursing research. It defines statistics as the science of making effective use of numerical data through collection, analysis, and interpretation. There are two main types of statistics: descriptive statistics which organize and summarize sample data, and inferential statistics which help determine if study outcomes are due to planned factors or chance. Key concepts covered include frequency distributions, measures of central tendency, variability, correlation, hypothesis testing, estimation, t-tests, chi-square tests, and analysis of variance procedures.B STAT PROJECTmmocx
B STAT PROJECTmmocxRaneem M Tulaimat
╠²
1) The document summarizes a study on the impact of sleeping hours on student performance between Banking and Finance (BNFN) and Management Information Systems (MIS) students.
2) It finds that the average sleeping hours per day is approximately the same between BNFN (6.1 hours) and MIS (5.7 hours) students, with no statistically significant difference in the means or variances based on t-test and F-test analyses.
3) The conclusion is that business students at the college have similar sleeping hours on average, despite different majors and course requirements.Measure of central tendency(0039)
Measure of central tendency(0039)Irfan Hussain
╠²
This document discusses measures of central tendency, which summarize a data set with a single value representing the center or typical value. There are three main types of measures: the arithmetic mean, which is the sum of all values divided by the number of values; the median, which is the middle value when data is ordered from lowest to highest; and the mode, which is the most frequently occurring value. The document provides formulas for calculating each of these measures and explains their properties and uses for summarizing and comparing data sets.Measures of central tendency
Measures of central tendencyJes├║s Rosas
╠²
Measures of central tendency are values that are central to a data set or distribution. The three most common measures are the mean, which is the average value calculated by dividing the sum of all data points by the total number of data points; the median, which is the middle value of the data set with half of the values above it and half below it; and the mode, which is the data value that occurs most frequently.Statistics for Medical students
Statistics for Medical studentsANUSWARUM
╠²
This document provides an overview of key concepts in statistics. It discusses how statistics is used to collect, organize, summarize, present, and analyze numerical data to derive valid conclusions. It defines common statistical terminology like data, quantitative vs. qualitative data, measures of central tendency (mean, median, mode), measures of variability (range, standard deviation), the normal distribution curve, and coefficient of variation. The document also explains common statistical tests like the z-test, t-test, ANOVA, chi-square test and concepts like sensitivity and specificity. Overall, the document serves as a high-level introduction to foundational statistical methods and analyses.Introduction to statistics
Introduction to statisticsScholarsPoint1
╠²
This document provides an introduction to statistics, including definitions, types, data measurement, and important terms. It defines statistics as the collection, analysis, interpretation, and presentation of numerical data. Statistics can be descriptive, dealing with conclusions about a particular group, or inferential, using a sample to make inferences about a larger population. There are four levels of data measurement - nominal, ordinal, interval, and ratio. Important statistical terms defined include population, sample, parameter, and statistic.4 measures of variability
4 measures of variabilityDr. Nazar Jaf
╠²
This document discusses measures of variability, or dispersion, which describe how spread out values are in a distribution. The five most commonly used measures are the range, interquartile range, variance, standard deviation, and coefficient of variation. The standard deviation is the most widely used measure for interval or ratio data, as it indicates the average deviation of values from the mean and describes whether a sample is heterogeneous or homogeneous. The standard deviation is calculated by computing the sum of squared deviations from the mean, dividing by the sample size minus one, and taking the square root.Measures of central tendency ict integration
Measures of central tendency ict integrationRichard Paulino
╠²
The document discusses different measures of central tendency including the mean, median, and mode. It provides definitions and formulas for calculating each. The mean is the average and is calculated by adding all values and dividing by the total count. The median is the middle value when data is arranged in order. The mode is the most frequently occurring value. Examples are provided to demonstrate calculating and interpreting these measures of central tendency.Measure of Central Tendency
Measure of Central TendencySharmin_Abeer
╠²
The document discusses measures of central tendency including the mean, median, and mode for ungrouped data sets.
The mean is the average and is calculated by adding all values in the data set and dividing by the number of values. The median is the middle number when data is arranged in order. For even data sets, the median is the average of the two middle numbers. The mode is the number that occurs most frequently in the data set. Sometimes there are multiple modes or no mode. The range is the difference between the highest and lowest values in the data set.Paktia university lecture prepare by hameed gul ahmadzai
Paktia university lecture prepare by hameed gul ahmadzaiHameedgul Ahmadzai
╠²
The document is an introductory textbook on statistics prepared for higher secondary students in Tamil Nadu. It covers various aspects of statistics, including definitions, collection methods, data analysis techniques, applications in various fields, and limitations. The text aims to highlight the importance of statistics in modern society and provide foundational knowledge for students.MEASURES OF CENTRAL TENDENCIES_102909.pptx
MEASURES OF CENTRAL TENDENCIES_102909.pptxJiwaji university
╠²
This document provides an overview of measures of central tendency including the mean, median, and mode. It defines each measure and explains how to calculate them. The mean is the average value obtained by dividing the total of all values by the number of values. The median is the middle value when values are arranged in order. The mode is the most frequent value in the data set. The document also discusses how the appropriate measure depends on the type of scale of the data, with the mode used for nominal data, the median for ordinal data, and the mean for interval data.Upload 140103034715-phpapp01 (1)
Upload 140103034715-phpapp01 (1)captaininfantry
╠²
This document discusses various measures of central tendency including the mean, median, and mode. It defines each measure and provides examples of how to calculate them for both grouped and ungrouped data. The mean is the sum of all values divided by the number of values and is the most widely used measure. The median is the middle value when data is ordered from lowest to highest. The mode is the most frequently occurring value. The document compares the properties of each measure and how they are affected by outliers. It also discusses when each measure is most appropriate to use.Applications of mean ,mode & median
Applications of mean ,mode & medianAnagha Deshpande
╠²
Mean, median, and mode are measures of central tendency that can be used to describe data sets. The mean is the average and includes all values, making it best for symmetrical distributions. The median is preferred for skewed distributions as it is not affected by outliers. The mode identifies the most frequent outcome and is useful for categorical preference data, though it can be problematic if there are multiple or outlier modes.Biostatistics measures of central tendency
Biostatistics measures of central tendencyKarmadipsinh Zala
╠²
This document discusses different types of measures of central tendency used in biostatistics:
- The mean is the average value calculated by adding all data points and dividing by the total number of points.
- The median is the middle value when all data points are ordered.
- The mode is the most frequently occurring value.
It also explains what the geometric mean is, calculated as the nth root of the product of n numbers. Several merits and limitations of the geological mean are provided.Measures of central tendency
Measures of central tendencykurthDelossantos
╠²
The document discusses different measures of central tendency:
- The mode is the most frequent score in a data set and is used for nominal data.
- The median is the middle score when data is arranged from lowest to highest and is not influenced by outliers.
- The mean is the average of all scores, calculated by summing all scores and dividing by the total number, and is preferred for interval/ratio scaled and non-skewed data.Statistics by DURGESH JHARIYA OF jnv,bn,jbp
Statistics by DURGESH JHARIYA OF jnv,bn,jbpDJJNV
╠²
This document provides an overview of statistics, including definitions of continuous and discrete variables, the importance of random sampling to avoid bias, and basic statistical calculations such as mean, variance, and standard deviation. It explains the null hypothesis, the application of t-tests and chi-square tests for determining significant differences between sample populations, and introduces key concepts of probability. Additionally, it highlights the relationship between sample size and standard error, emphasizing the use of statistical methods to infer population characteristics from samples.Business statistics
Business statisticsHomework Guru
╠²
Homework Guru offers comprehensive online tutoring and homework help for business statistics, catering to graduates and undergraduates. The document details the applications of statistics in various fields such as accounting, production, marketing, and financial advising, as well as the types and scales of data measurement. It also emphasizes the importance of accurate data collection and analysis while promoting the expert tutoring services available through Homework Guru.More Related Content
What's hot (20)
3 measures of central dendency
3 measures of central dendencyDr. Nazar Jaf
╠²
This document discusses measures of central tendency, which are summary measures that describe the middle or center of a data set with a single value. The three main measures are the mode, median, and mean. The mode is the most frequently occurring value, the median is the middle value when data are arranged in order, and the mean is the average calculated by summing all values and dividing by the total number of data points. The appropriate measure depends on the shape and type of data. Symmetrical distributions have equal mode, median and mean, while skewed distributions cause the mean to be "pulled" away from the middle.Data Display and Summary
Data Display and SummaryDrZahid Khan
╠²
This document provides an overview of key concepts in biostatistics including data display and summary. It defines different types of data, variables, and statistical measures. Descriptive statistics like mean, median and mode are used to summarize central tendencies, while measures like range, variance and standard deviation describe data dispersion. Various graphs including histograms, boxplots and stem-and-leaf plots are discussed as tools for data visualization.Business statistics
Business statisticsRavi Prakash
╠²
This document discusses measures of central tendency and dispersion in statistics. It defines central tendency as a single value that describes the center of a data distribution. Common measures include the mean, median, and mode. The mean is the average value calculated by adding all values and dividing by the total number. The median is the middle value when data is ordered from lowest to highest. The mode is the most frequent value. Dispersion measures the spread of data and includes the range, mean deviation, standard deviation, and variance. Standard deviation summarizes how far data points are from the mean. Variance is the square of the standard deviation. The document provides examples of calculating these measures and their characteristics and uses.Central tendency
Central tendency Sudipto Krishna Dutta
╠²
This document discusses measures of central tendency. It defines central tendency as a statistical measure that identifies a single value that best represents an entire data set. The three main measures are the mean, median, and mode.
The mean is the average value, calculated by summing all values and dividing by the total number. The median is the middle value when data is arranged in order. The mode is the most frequently occurring value.
The document provides examples and formulas to calculate each measure. It also discusses advantages and disadvantages of each, and gives examples of how they are used in daily life situations like measuring student test scores or transportation usage.Measures of central tendency ict integration
Measures of central tendency ict integrationRichard Paulino
╠²
The document discusses different measures of central tendency including the mean, median, and mode. It provides definitions and formulas for calculating each. The mean is the average and is calculated by adding all values and dividing by the total count. The median is the middle value when data is arranged in order. The mode is the most frequently occurring value. Examples are given to demonstrate calculating and interpreting each measure of central tendency.Statstics in nursing
Statstics in nursing Monika Devi NR
╠²
The document provides an overview of statistics as used in nursing research. It defines statistics as the science of making effective use of numerical data through collection, analysis, and interpretation. There are two main types of statistics: descriptive statistics which organize and summarize sample data, and inferential statistics which help determine if study outcomes are due to planned factors or chance. Key concepts covered include frequency distributions, measures of central tendency, variability, correlation, hypothesis testing, estimation, t-tests, chi-square tests, and analysis of variance procedures.B STAT PROJECTmmocx
B STAT PROJECTmmocxRaneem M Tulaimat
╠²
1) The document summarizes a study on the impact of sleeping hours on student performance between Banking and Finance (BNFN) and Management Information Systems (MIS) students.
2) It finds that the average sleeping hours per day is approximately the same between BNFN (6.1 hours) and MIS (5.7 hours) students, with no statistically significant difference in the means or variances based on t-test and F-test analyses.
3) The conclusion is that business students at the college have similar sleeping hours on average, despite different majors and course requirements.Measure of central tendency(0039)
Measure of central tendency(0039)Irfan Hussain
╠²
This document discusses measures of central tendency, which summarize a data set with a single value representing the center or typical value. There are three main types of measures: the arithmetic mean, which is the sum of all values divided by the number of values; the median, which is the middle value when data is ordered from lowest to highest; and the mode, which is the most frequently occurring value. The document provides formulas for calculating each of these measures and explains their properties and uses for summarizing and comparing data sets.Measures of central tendency
Measures of central tendencyJes├║s Rosas
╠²
Measures of central tendency are values that are central to a data set or distribution. The three most common measures are the mean, which is the average value calculated by dividing the sum of all data points by the total number of data points; the median, which is the middle value of the data set with half of the values above it and half below it; and the mode, which is the data value that occurs most frequently.Statistics for Medical students
Statistics for Medical studentsANUSWARUM
╠²
This document provides an overview of key concepts in statistics. It discusses how statistics is used to collect, organize, summarize, present, and analyze numerical data to derive valid conclusions. It defines common statistical terminology like data, quantitative vs. qualitative data, measures of central tendency (mean, median, mode), measures of variability (range, standard deviation), the normal distribution curve, and coefficient of variation. The document also explains common statistical tests like the z-test, t-test, ANOVA, chi-square test and concepts like sensitivity and specificity. Overall, the document serves as a high-level introduction to foundational statistical methods and analyses.Introduction to statistics
Introduction to statisticsScholarsPoint1
╠²
This document provides an introduction to statistics, including definitions, types, data measurement, and important terms. It defines statistics as the collection, analysis, interpretation, and presentation of numerical data. Statistics can be descriptive, dealing with conclusions about a particular group, or inferential, using a sample to make inferences about a larger population. There are four levels of data measurement - nominal, ordinal, interval, and ratio. Important statistical terms defined include population, sample, parameter, and statistic.4 measures of variability
4 measures of variabilityDr. Nazar Jaf
╠²
This document discusses measures of variability, or dispersion, which describe how spread out values are in a distribution. The five most commonly used measures are the range, interquartile range, variance, standard deviation, and coefficient of variation. The standard deviation is the most widely used measure for interval or ratio data, as it indicates the average deviation of values from the mean and describes whether a sample is heterogeneous or homogeneous. The standard deviation is calculated by computing the sum of squared deviations from the mean, dividing by the sample size minus one, and taking the square root.Measures of central tendency ict integration
Measures of central tendency ict integrationRichard Paulino
╠²
The document discusses different measures of central tendency including the mean, median, and mode. It provides definitions and formulas for calculating each. The mean is the average and is calculated by adding all values and dividing by the total count. The median is the middle value when data is arranged in order. The mode is the most frequently occurring value. Examples are provided to demonstrate calculating and interpreting these measures of central tendency.Measure of Central Tendency
Measure of Central TendencySharmin_Abeer
╠²
The document discusses measures of central tendency including the mean, median, and mode for ungrouped data sets.
The mean is the average and is calculated by adding all values in the data set and dividing by the number of values. The median is the middle number when data is arranged in order. For even data sets, the median is the average of the two middle numbers. The mode is the number that occurs most frequently in the data set. Sometimes there are multiple modes or no mode. The range is the difference between the highest and lowest values in the data set.Paktia university lecture prepare by hameed gul ahmadzai
Paktia university lecture prepare by hameed gul ahmadzaiHameedgul Ahmadzai
╠²
The document is an introductory textbook on statistics prepared for higher secondary students in Tamil Nadu. It covers various aspects of statistics, including definitions, collection methods, data analysis techniques, applications in various fields, and limitations. The text aims to highlight the importance of statistics in modern society and provide foundational knowledge for students.MEASURES OF CENTRAL TENDENCIES_102909.pptx
MEASURES OF CENTRAL TENDENCIES_102909.pptxJiwaji university
╠²
This document provides an overview of measures of central tendency including the mean, median, and mode. It defines each measure and explains how to calculate them. The mean is the average value obtained by dividing the total of all values by the number of values. The median is the middle value when values are arranged in order. The mode is the most frequent value in the data set. The document also discusses how the appropriate measure depends on the type of scale of the data, with the mode used for nominal data, the median for ordinal data, and the mean for interval data.Upload 140103034715-phpapp01 (1)
Upload 140103034715-phpapp01 (1)captaininfantry
╠²
This document discusses various measures of central tendency including the mean, median, and mode. It defines each measure and provides examples of how to calculate them for both grouped and ungrouped data. The mean is the sum of all values divided by the number of values and is the most widely used measure. The median is the middle value when data is ordered from lowest to highest. The mode is the most frequently occurring value. The document compares the properties of each measure and how they are affected by outliers. It also discusses when each measure is most appropriate to use.Applications of mean ,mode & median
Applications of mean ,mode & medianAnagha Deshpande
╠²
Mean, median, and mode are measures of central tendency that can be used to describe data sets. The mean is the average and includes all values, making it best for symmetrical distributions. The median is preferred for skewed distributions as it is not affected by outliers. The mode identifies the most frequent outcome and is useful for categorical preference data, though it can be problematic if there are multiple or outlier modes.Biostatistics measures of central tendency
Biostatistics measures of central tendencyKarmadipsinh Zala
╠²
This document discusses different types of measures of central tendency used in biostatistics:
- The mean is the average value calculated by adding all data points and dividing by the total number of points.
- The median is the middle value when all data points are ordered.
- The mode is the most frequently occurring value.
It also explains what the geometric mean is, calculated as the nth root of the product of n numbers. Several merits and limitations of the geological mean are provided.Measures of central tendency
Measures of central tendencykurthDelossantos
╠²
The document discusses different measures of central tendency:
- The mode is the most frequent score in a data set and is used for nominal data.
- The median is the middle score when data is arranged from lowest to highest and is not influenced by outliers.
- The mean is the average of all scores, calculated by summing all scores and dividing by the total number, and is preferred for interval/ratio scaled and non-skewed data.Viewers also liked (6)
Statistics by DURGESH JHARIYA OF jnv,bn,jbp
Statistics by DURGESH JHARIYA OF jnv,bn,jbpDJJNV
╠²
This document provides an overview of statistics, including definitions of continuous and discrete variables, the importance of random sampling to avoid bias, and basic statistical calculations such as mean, variance, and standard deviation. It explains the null hypothesis, the application of t-tests and chi-square tests for determining significant differences between sample populations, and introduces key concepts of probability. Additionally, it highlights the relationship between sample size and standard error, emphasizing the use of statistical methods to infer population characteristics from samples.Business statistics
Business statisticsHomework Guru
╠²
Homework Guru offers comprehensive online tutoring and homework help for business statistics, catering to graduates and undergraduates. The document details the applications of statistics in various fields such as accounting, production, marketing, and financial advising, as well as the types and scales of data measurement. It also emphasizes the importance of accurate data collection and analysis while promoting the expert tutoring services available through Homework Guru.Introduction to business statistics
Introduction to business statisticsAakash Kulkarni
╠²
This chapter introduces the basic concepts and terminology of statistics. It discusses two main branches of statistics - descriptive statistics which involves collecting, organizing and summarizing data, and inferential statistics which allows drawing conclusions about populations from samples. The chapter also covers variables, populations, samples, parameters, statistics and how to organize and visualize data through tables, charts and graphs. It emphasizes that statistics helps turn data into useful information for decision making in business.Strategic Management: Inditex Group (focus
Strategic Management: Inditex Group (focusAlba Romero Villa
╠²
The document analyzes the strategic management of a fast fashion brand, focusing on market dynamics, competitive forces, and a SWOT analysis. It highlights strengths such as a strong brand presence and efficient supply chain, while noting weaknesses like poor brand identity and low consumer loyalty. Additionally, it discusses opportunities for ethical production and online market expansion alongside threats from high competition and economic downturns.Zara's Fast-Fashion Edge
Zara's Fast-Fashion EdgePhi Jack
╠²
This document provides information about Zara, the largest clothing company owned by the Spanish fashion group Inditex. It discusses Zara's business model, strategies, and supply chain management approach. Zara aims to continuously innovate and provide new, affordable designs made from quality materials to satisfy customer desires. Through its fast fashion model, Zara is able to design, produce, and distribute new collections to stores within weeks, allowing it to stay on top of the latest trends. Zara has over 1,900 stores globally and is a leader in the fast fashion industry due to its ability to quickly replicate designs at low prices.Business Statistics
Business Statisticsshorab
╠²
This document summarizes key descriptive statistics measures used to describe data, including measures of location (mean, median, mode) and measures of variability (range, interquartile range, variance, standard deviation, coefficient of variation). It provides examples calculating these measures using a sample data set of monthly rents for one-bedroom apartments. Formulas and explanations are given for how to compute each measure.Ad
Similar to Statistic assignment (muti rara zara citra) (20)
Central tedency
Central tedencyDAndraGreen
╠²
The document defines and provides examples of three measures of central tendency: mean, median, and mode. It explains that the mean is the average and is calculated by adding all values and dividing by the total number. The median is the middle number when values are sorted. The mode is the value that appears most frequently in the data set.presentation2.pptx
presentation2.pptxJOANNAMARIECAOILE
╠²
This document provides information about measures of central tendency including the mean, median, and mode. It defines each measure and provides examples of how to calculate them using statistical data. Students are asked to practice calculating the mean, median, and mode of various data sets and identify which measure is best to use in different situations.Descriptive statistics i
Descriptive statistics iMohammad Ihmeidan
╠²
Here are the steps to find the quartiles for this data set:
1. Order the data from lowest to highest: 1, 1, 2, 2, 2, 2, 3, 3, 4, 4, 5, 5, 6, 7
2. The number of observations is 16. To find the quartiles, we split the data into 4 equal parts.
3. n/4 = 16/4 = 4
4. Q1 is the median of the lower half of the data, which is the 4th observation: 2
5. Q2 is the median of all the data, which is also the 8th observation: 3
6. Q3 is the median of the upper halfSP and R.pptx
SP and R.pptxssuserfc98db
╠²
This document provides information about statistics and probability. It defines statistics as the collection, analysis, and interpretation of data. There are two main categories of statistics: descriptive statistics, which summarizes and describes data, and inferential statistics, which is used to estimate, predict, and generalize results. The document also discusses population and sample, measures of central tendency (mean, median, mode), measures of dispersion (range, variance, standard deviation), qualitative vs. quantitative data, ways of representing quantitative data (numerically and graphically), and examples of organizing data using a stem-and-leaf plot.Statistics and probability lesson6&7
Statistics and probability lesson6&7MARIA CHRISTITA POLINAG
╠²
This document provides examples and explanations of key measures of central tendency (mean, median, mode) and location (percentiles, deciles, quartiles) using data from test scores. It discusses how to calculate each measure and their properties. For a grouped data set of 130 test scores ranging from 10-108, it demonstrates calculating the mean as 61.45 and identifies the median class as 54-64 since it contains the value of 65, which is the midpoint of the data set. The document provides guidance on finding percentiles, deciles, and quartiles using the percentile formula and examples.Measures of central tendency
Measures of central tendencyAlex Chris
╠²
Measures of central tendency describe the middle or center of a data set and include the mean, median, and mode. The mean is the average value calculated by adding all values and dividing by the number of values. The median is the middle number in a data set arranged in order. The mode is the value that occurs most frequently. These measures are used to understand the typical or common values in a data set.data
datasom allul
╠²
This document discusses analyzing and summarizing data. It defines key terms like data, variables, and different types of data including quantitative, qualitative, discrete, and continuous data. It also discusses different types of data analysis including descriptive, exploratory, inferential, predictive, causal, and mechanistic. Finally, it explains measures of central tendency including the mean, median, and mode. It provides examples and formulas for calculating each as well as their advantages and disadvantages.MEAN MEDIAN MODE.ppt
MEAN MEDIAN MODE.pptJenelynMangalayOrenc
╠²
This document provides instructions and examples for calculating measures of central tendency (mean, median, mode) using data sets. It begins with objectives and motivation by introducing mean, median and mode. Examples are provided to demonstrate calculating the mean, median and mode of students' test scores. Formulas and step-by-step processes are outlined for each measure. The document concludes by providing practice problems for students to calculate mean, median, mode and range for various data sets.measuresofcentraltendency-141113111140-conversion-gate02.ppt
measuresofcentraltendency-141113111140-conversion-gate02.ppttrainermariadunong
╠²
The document discusses measures of central tendency, including mean, median, and mode, which summarize the characteristics of a dataset. It explains how to compute each measure, their advantages and disadvantages, and their applicability in statistical analysis. The mean is noted as the most common measure, while the median provides the middle value, and the mode indicates the most frequently occurring score.Statistics for math (English Version)
Statistics for math (English Version)Tito_14
╠²
The document discusses different types of data and statistical methods. It provides examples of qualitative and quantitative data. It also explains various ways to represent data visually, including pie charts, bar charts, histograms, line graphs, and more. Finally, it gives examples of calculating common statistical measures like the mean, median, mode, and quartiles from raw data sets.Statistics
Statisticsitutor
╠²
This document provides an overview of key concepts in statistics including:
- Statistics involves collecting, organizing, analyzing, and interpreting numerical data.
- There are two main types of statistics: descriptive and inferential.
- Data can be categorical or quantitative. Common measures of central tendency are the mean, median, and mode.
- There are different sampling methods like random, stratified, and cluster sampling.
- Data is often organized and displayed using tables, graphs like histograms, bar charts and pie charts.ANA 809 - Measures of Central Tendency - Emmanuel Uchenna.pptx
ANA 809 - Measures of Central Tendency - Emmanuel Uchenna.pptxEmmanuelUchenna7
╠²
The document discusses measures of central tendency in statistics, focusing on the mean, median, and mode, and their significance in summarizing data sets. Each measure is explained with examples and guidance on when to use them effectively, especially in the presence of skewed distributions or grouped data. It concludes by emphasizing the importance of these measures in various fields such as finance and social sciences for data analysis and decision-making.Lecture_4_-_Data_Management_using_Statistics(3).pptx
Lecture_4_-_Data_Management_using_Statistics(3).pptxssuser10eca22
╠²
This document discusses key concepts in statistics including descriptive statistics, inferential statistics, measures of central tendency (mean, median, mode), measures of dispersion (range, variance, standard deviation), and measures of relative position (percentiles, quartiles, deciles). It provides examples of calculating these statistical measures from sample data sets. The document also covers methods of data collection and presentation including raw vs grouped data and textual, tabular, and graphical presentation formats.Measure of central tendency by touseef.pptx
Measure of central tendency by touseef.pptxMuhammadTouseefKhan2
╠²
The document discusses the concept of central tendency in statistics, explaining its importance in frequency distributions. It covers three main measures: mean, median, and mode, with definitions, calculations, advantages, and disadvantages for each. Examples illustrate how to compute these measures using sample data.bareera MATHEMATICS PRESENTAT alebraION.pptx
bareera MATHEMATICS PRESENTAT alebraION.pptxAqsaBatool33
╠²
The document discusses the concepts of mean, median, and mode as measures of central tendency used to describe data sets. It provides formulas and examples for calculating the mean, median, and mode for both ungrouped and grouped data, particularly in relation to student scores. It highlights the importance of these measures in understanding the center position of a data set. analytical representation of data
analytical representation of dataUnsa Shakir
╠²
This document discusses analytical representation of data through descriptive statistics. It begins by showing raw, unorganized data on movie genre ratings. It then demonstrates organizing this data into a frequency distribution table and bar graph to better analyze and describe the data. It also calculates averages for each movie genre. The document then discusses additional descriptive statistics measures like the mean, median, mode, and percentiles to further analyze data through measures of central tendency and dispersion.Measures of Central Tendency of Ungroup Data-Demo.pptx
Measures of Central Tendency of Ungroup Data-Demo.pptxRoquiMabugayGonzaga
╠²
The document provides instructions for learning about measures of central tendency. It discusses finding the mean, median, and mode of ungrouped data. The mean is calculated by adding all values and dividing by the number of values. The median is the middle value when data is arranged in order. The mode is the most frequent value. Examples are provided to demonstrate calculating the mean, median, and mode of various data sets.Mean, Median, Mode
Mean, Median, ModeNarmatha Devi N
╠²
This document defines and provides examples of mean, median, and mode - three common measures of central tendency. The mean is the average and is calculated by summing all values and dividing by the number of values. The median is the middle value when values are arranged in order. The mode is the most frequent value in the data set. Examples are provided to demonstrate calculating each measure for sample data sets.Statistics
StatisticsKedhar Guhan
╠²
This document discusses various statistical concepts taught in 9th grade including histograms, frequency polygons, and numerical representatives of ungrouped data. It then introduces concepts related to grouped data such as calculating the mean, median, and mode of grouped data using different methods like the direct method, assumed mean method, and step deviation method. It also discusses the concepts of cumulative frequency, ogives (cumulative frequency curves), and how to find the median from an ogive.Ad
Statistic assignment (muti rara zara citra)
- 1. STATISTICS MATH ASSIGNMENT IX D ŌĆó Kirana Ayu Imani ŌĆó Siska Mutiara ŌĆó Niluh Putu Citra Dewi ŌĆó Zahra Nabilah
- 2. What Is Statistics ? ŌĆó Statistics is the science or scientific method of collecting, organizing, processing, presenting and analyzing data and drawing conclusion according to the result of the data analysis. ŌĆó Statistics is the study of statistics from a mathematical standpoint, using probability theory as well as other branches of mathematics such as linear algebra and analysis. The term "mathematical statistics" is closely related to the term "statistical theory" but also embraces modelling for actuarial science and non-statistical probability theory. ŌĆó Statistics is the science of collecting, organizing and summarizing data such that valid conclusions can be made from them. The collecting, organizing and summarizing part is called ŌĆ£descriptive statisticsŌĆØ, while making valid conclusions is inferential statistics.
- 3. Collection of Data ŌĆó Collection of the data is the beginning stage (the first step) in the statistical activity. Collecting data can be performed by interview of questionnaire,then continued by one of the following activities : 1. Counting 2. Measuring 3. Recording data by tallies
- 4. Two Types Of Statistica Data ŌĆó QUANTITATIVE data are obtained from the result of numerical recording(in the form of figures) ŌĆó QUALITATIVE data are data related to the category of characteristics of an object.
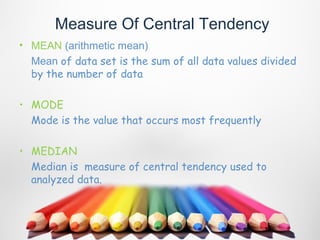
- 5. Measure Of Central Tendency ŌĆó MEAN (arithmetic mean) Mean of data set is the sum of all data values divided by the number of data ŌĆó MODE Mode is the value that occurs most frequently ŌĆó MEDIAN Median is measure of central tendency used to analyzed data.
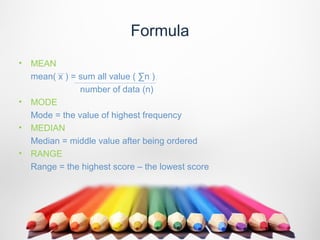
- 6. Formula ŌĆó MEAN mean( x ) = sum all value ( Ōłæn ) number of data (n) ŌĆó MODE Mode = the value of highest frequency ŌĆó MEDIAN Median = middle value after being ordered ŌĆó RANGE Range = the highest score ŌĆō the lowest score
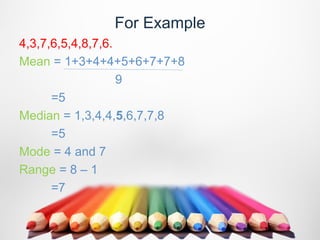
- 7. For Example 4,3,7,6,5,4,8,7,6. Mean = 1+3+4+4+5+6+7+7+8 9 =5 Median = 1,3,4,4,5,6,7,7,8 =5 Mode = 4 and 7 Range = 8 ŌĆō 1 =7
- 8. We had tried to survey about ŌĆ£ How Much Your Daily Pocket Money ?ŌĆØ And ŌĆ£ How Long Your Time To Study ?ŌĆØ In grade VII A , Total students is 30. And the result is ŌĆ”
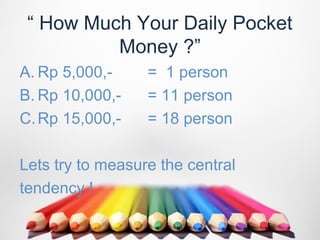
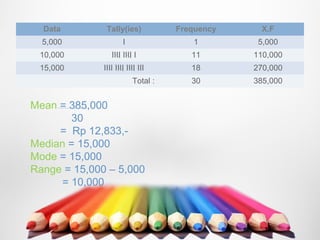
- 9. ŌĆ£ How Much Your Daily Pocket Money ?ŌĆØ A. Rp 5,000,- = 1 person B. Rp 10,000,- = 11 person C. Rp 15,000,- = 18 person Lets try to measure the central tendency !
- 10. Data Tally(ies) Frequency X.F 5,000 I 1 5,000 10,000 IIII IIII I 11 110,000 15,000 IIII IIII IIII III 18 270,000 Total : 30 385,000 Mean = 385,000 30 = Rp 12,833,- Median = 15,000 Mode = 15,000 Range = 15,000 ŌĆō 5,000 = 10,000
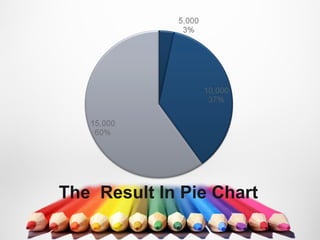
- 11. The Result In Pie Chart
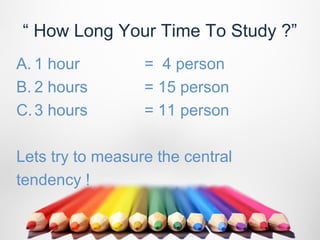
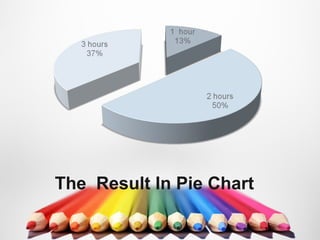
- 12. ŌĆ£ How Long Your Time To Study ?ŌĆØ A. 1 hour = 4 person B. 2 hours = 15 person C. 3 hours = 11 person Lets try to measure the central tendency !
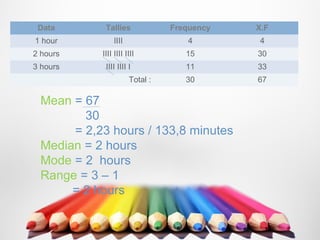
- 13. Data Tallies Frequency X.F 1 hour IIII 4 4 2 hours IIII IIII IIII 15 30 3 hours IIII IIII I 11 33 Total : 30 67 Mean = 67 30 = 2,23 hours / 133,8 minutes Median = 2 hours Mode = 2 hours Range = 3 ŌĆō 1 = 2 hours
- 14. The Result In Pie Chart
- 15. T h a n k y y o u