際際滷

際際滷Share a Scribd company logo
LESSON 5:
CALCULATING MEAN AND
VARIANCE OF A DISCRETE
RANDOM VARIABLE
THE MEAN
a. The average of all possible outcomes. It is
otherwise referred to as the expected value
of a probability distribution.
b. Means that if we repeat any given experiment
infinite times, the theoretical mean would be the
expected value.
c. Any discrete probability distribution has a
mean.
THE VARIANCE AND STANDARD
DEVIATION
The VARIANCE of a random
variable displays the variability or the
dispersions of the random variables.
It shows the distance of a random
variable from its mean.
THE VARIANCE AND STANDARD
DEVIATION
a. If the values of the variance and standard deviation
are HIGH, that means that the individual outcomes
of the experiment are far relative to each other. In
other words, the values differ greatly.
b. A large value of standard deviation (or variance)
means that the distribution is spread out, with
some possibility of observing values at some
distance from the mean.
THE VARIANCE AND STANDARD
DEVIATION
c. If the variance and standard deviation are LOW, that
means that the individual outcomes of the
experiment are closely spaced with each other. In
other words, the values are almost the same values
or if they do differ, the difference is small.
d. A small value of standard deviation (or variance)
means that the dispersion of the random variable is
narrowly concentrated around the mean.
Mean, variance, and
standard deviation can
be illustrated by looking
pattern and analyzing given
illustrations and diagrams.
During Town Fiesta, people used to go to Carnival
that most folks call it Perya. Mang Ben used to play
Betobeto hoping that he would win. While he is
thinking about what possible outcomes in every roll
would be, he is always hoping that his bet is right.
X 1 2 3 4 5 6
P(X) 


EXAMPLE
1.Is the probability of X lies between 0 and 1?
2.What is the sum of all probabilities of X?
3.Is there a negative probability? Is it possible
to have a negative probability?
4.How will you illustrate the average or mean
of the probabilities of discrete random
variable?
QUESTIONS:
1.Is the probability of x lies between 0
and 1?
Yes, the probability of X lies between 0
and 1.
X 1 2 3 4 5 6
P(X) 


SOLUTION:
2. What is the sum of all probabilities of X?
犒   =   +   +   +   +   +  
=


+


+


+


+


+


=
+++++

=


The sum of all probabilities of X is exactly 1.
X 1 2 3 4 5 6
P(X) 


SOLUTION:
3. Is there a negative probability? Is it possible
to have a negative probability?
No negative probabilities because it is
impossible to have it based on the
characteristic of the probability of
discrete random variables.
SOLUTION:
In a seafood restaurant, the
manager wants to know if their
customers like their new raw large
oysters. According to their sales
representative, in the past 4 months,
the number of oysters consumed by
a customer, along with its
corresponding probabilities, is
shown in the succeeding table.
Compute the mean, variance and
standard deviation.
Number of
oysters
consumed
X
Probabilit
y
P(X)
0 

1 

2 

3 

4 
EXAMPLE 1
(X) P(X) X  P(X) . (  )族 (  )族  ()
0 .     .  =
. 
.  
= . 
.   .  = . 
1 .  0.2   .  = .  .  
= . 
.   .  = . 
2 .  0.6   .  = .  .  
= .  .   .  = . 
3 .  0.6   .  = .  .  
= .  .   .  = . 
4 .  0.4 4.  = .  .  
= .  .   .  = .
1.What is the mean?
 = 犒[  ()]
=  + .  + .  + .  + . 
 = . 
SOLUTION:
2. What is the standard deviation?
2
= 犒 (  )族 ()
= 0.448 + 0.128 + 0.012 + 0.288 + 0.484

. 
SOLUTION:
3. What is the standard deviation?
 =  (  )族 ()   = 2
 = 1.56
 = . 
SOLUTION:
Mr. Umali, a Mathematics
teacher, regularly gives a
formative assessment composed
of 5 multiple-choice items. After
the assessment, he used to
check the probability
distribution of the correct
responses, and the data is
presented below:
TEST ITEM
(X)
Probability
()
0 0.03
1 0.05
2 0.12
3 0.30
4 0.28
5 0.22
EXAMPLE 2
1.What is the average or mean of the given
probability distribution?
2.What are the values of the variance of the
probability distribution?
3.What are the values of standard deviation
of the probability distribution?
QUESTIONS:
X P(X) X  P(X) X -  (X - )族 (X - )族  P(X)
0 0.03 0  0.03 = 0 0  3.41 = 3.41 (3.41)族 = 11.63 11.63  .  = . 
1 0.05 1  0.05
= 0.05
1  3.41 = 2.41 (2.41)族 = 5.81 5.   .  = . 
2 0.12 2  0.12
= 0.24
2  3.41 = 1.41 (1.41)族 = 1.99 1.   .  = . 
3 0.30 3  0.30
= 0.90
3  3.41 = 0.41 (0.41)族 = 0.17 0.   .  = . 
4 0.28 4  0.28
= 1.12
4  3.41 = 0.59 (0.59)族 = 0.35 0.35  .  = . 
5 0.22 5  0.22
= 1.10
5  3.41 = 1.59 (1.59)族 = 2.53 2.53  .  = . 
 = .  
= .
1.What is the mean?
 = 犒[  ()]
=  + .  + .  + .  + .  + . 
 = . 
SOLUTION:
2. What is the standard deviation?
2
= 犒 (  )族 ()
= .  + .  + .  + .  + .  + 

= . 
SOLUTION:
3. What is the standard deviation?
 =  (  )族 ()   = 2
 = 1.59
 = . 
SOLUTION:
1. The number of shoes sold per day at a retail store is shown in the
table below. Illustrate the mean, variance, and standard deviation
of this distribution.
Write all the necessary formula and show the complete solution.
Formula to be used: (a)Mean, (b)Variance,(c) Standard
Deviation
X 19 20 21 22 23
P(X) 0.4 0.2 0.2 0.1 0.1
ACTIVITY 1
1. The Land Bank of the Philippines Manager claimed
that each saving account customer has several
credit cards. The following distribution showing the
number of credits cards people own.
a. Calculate the mean, variance, and standard deviation
of a discrete random variable.
X 0 1 2 3 4
P(X) 0.18 0.44 0.27 0.08 0.03
ASSIGNMENT
2. Suppose an unfair die is rolled and let X be the
random variable representing the number of dots
that would appear with a probability distribution
below.
a. Calculate the mean, variance, and standard deviation
of a discrete random variable.
OUTCOME (X) 1 2 3 4 5 6
Probability (X) 0.1 0.1 0.1 0.5 0.1 0.1
1. The number of cellular phones sold per day at
the E-Cell Retail Store with the corresponding
probabilities is shown in the table below.
Compute the mean, variance, and standard
deviation and interpret the result.
() 15 18 19 20 22
Probability () 0.30 0.20 0.20 0.15 0.15
Ad

More Related Content

Similar to STATISTICS - LESSON no 1 - MIDTERM-2.pdf (20)

Probability and Statistics - Week 2
Probability and Statistics - Week 2Probability and Statistics - Week 2
Probability and Statistics - Week 2
Ferdin Joe John Joseph PhD
STATISTICS & PROBABILITY-calculating the variance and standard deviation.pptx
STATISTICS & PROBABILITY-calculating the variance and standard deviation.pptxSTATISTICS & PROBABILITY-calculating the variance and standard deviation.pptx
STATISTICS & PROBABILITY-calculating the variance and standard deviation.pptx
Jay Garalde
Mean, Variance and standard deviation.pptx
Mean, Variance and standard deviation.pptxMean, Variance and standard deviation.pptx
Mean, Variance and standard deviation.pptx
JakeGad
keep215 lecture of satstical type of data .pdf
keep215 lecture of satstical  type of data .pdfkeep215 lecture of satstical  type of data .pdf
keep215 lecture of satstical type of data .pdf
hebaelkouly
11-Finding-the-Mean-and-Variance-of-the-Sampling-Distribution-of-Means.pptx
11-Finding-the-Mean-and-Variance-of-the-Sampling-Distribution-of-Means.pptx11-Finding-the-Mean-and-Variance-of-the-Sampling-Distribution-of-Means.pptx
11-Finding-the-Mean-and-Variance-of-the-Sampling-Distribution-of-Means.pptx
dominicdaltoncaling2
Mathematics with nice undestand.pdf
Mathematics with nice undestand.pdfMathematics with nice undestand.pdf
Mathematics with nice undestand.pdf
elistemidayo
Mean, variance, and standard deviation of a Discrete Random Variable
Mean, variance, and standard deviation of a Discrete Random VariableMean, variance, and standard deviation of a Discrete Random Variable
Mean, variance, and standard deviation of a Discrete Random Variable
Michael Ogoy
PSUnit_I_Lesson_4_Computing_the_Variance_of_a_Discrete_Probability_Distributi...
PSUnit_I_Lesson_4_Computing_the_Variance_of_a_Discrete_Probability_Distributi...PSUnit_I_Lesson_4_Computing_the_Variance_of_a_Discrete_Probability_Distributi...
PSUnit_I_Lesson_4_Computing_the_Variance_of_a_Discrete_Probability_Distributi...
jaysongulla1
Machine Learning - Probability Distribution.pdf
Machine Learning - Probability Distribution.pdfMachine Learning - Probability Distribution.pdf
Machine Learning - Probability Distribution.pdf
Maleeshapathirana
Chapter 1 random variables and probability distributions
Chapter 1   random variables and probability distributionsChapter 1   random variables and probability distributions
Chapter 1 random variables and probability distributions
Antonio F. Balatar Jr.
Statistics and Probability-Random Variables and Probability Distribution
Statistics and Probability-Random Variables and Probability DistributionStatistics and Probability-Random Variables and Probability Distribution
Statistics and Probability-Random Variables and Probability Distribution
April Palmes
1.1 mean, variance and standard deviation
1.1 mean, variance and standard deviation1.1 mean, variance and standard deviation
1.1 mean, variance and standard deviation
ONE Virtual Services
MODULE-1-LESSON-3-MEAN-VARIANCE-AND-STANDARD-DEVIATION (2).pdf
MODULE-1-LESSON-3-MEAN-VARIANCE-AND-STANDARD-DEVIATION (2).pdfMODULE-1-LESSON-3-MEAN-VARIANCE-AND-STANDARD-DEVIATION (2).pdf
MODULE-1-LESSON-3-MEAN-VARIANCE-AND-STANDARD-DEVIATION (2).pdf
ClintIkn
Probability.pptx Powerpoint presentaionc
Probability.pptx Powerpoint presentaioncProbability.pptx Powerpoint presentaionc
Probability.pptx Powerpoint presentaionc
ChrisTian609473
STATISTICS AND PROBABILITY GRADE 11 2024
STATISTICS AND PROBABILITY GRADE 11  2024STATISTICS AND PROBABILITY GRADE 11  2024
STATISTICS AND PROBABILITY GRADE 11 2024
Inzo Arnaldo Village Integrated School
LSCM 2072_chapter 1.ppt social marketing management
LSCM 2072_chapter 1.ppt social marketing managementLSCM 2072_chapter 1.ppt social marketing management
LSCM 2072_chapter 1.ppt social marketing management
DagimNegash1
understanding-key-concepts-of-probability-and-random-variables-through-exampl...
understanding-key-concepts-of-probability-and-random-variables-through-exampl...understanding-key-concepts-of-probability-and-random-variables-through-exampl...
understanding-key-concepts-of-probability-and-random-variables-through-exampl...
elistemidayo
Probability Models and Random Variables
Probability Models and Random VariablesProbability Models and Random Variables
Probability Models and Random Variables
pwheeles
Computing the Variance of a Discrete Probability Distribution.pptx
Computing the Variance of a Discrete Probability Distribution.pptxComputing the Variance of a Discrete Probability Distribution.pptx
Computing the Variance of a Discrete Probability Distribution.pptx
JohnReyLanguidoQuija
probalilty and STATistics - PowerPT.pptx
probalilty and STATistics - PowerPT.pptxprobalilty and STATistics - PowerPT.pptx
probalilty and STATistics - PowerPT.pptx
dans15pats
STATISTICS & PROBABILITY-calculating the variance and standard deviation.pptx
STATISTICS & PROBABILITY-calculating the variance and standard deviation.pptxSTATISTICS & PROBABILITY-calculating the variance and standard deviation.pptx
STATISTICS & PROBABILITY-calculating the variance and standard deviation.pptx
Jay Garalde
Mean, Variance and standard deviation.pptx
Mean, Variance and standard deviation.pptxMean, Variance and standard deviation.pptx
Mean, Variance and standard deviation.pptx
JakeGad
keep215 lecture of satstical type of data .pdf
keep215 lecture of satstical  type of data .pdfkeep215 lecture of satstical  type of data .pdf
keep215 lecture of satstical type of data .pdf
hebaelkouly
11-Finding-the-Mean-and-Variance-of-the-Sampling-Distribution-of-Means.pptx
11-Finding-the-Mean-and-Variance-of-the-Sampling-Distribution-of-Means.pptx11-Finding-the-Mean-and-Variance-of-the-Sampling-Distribution-of-Means.pptx
11-Finding-the-Mean-and-Variance-of-the-Sampling-Distribution-of-Means.pptx
dominicdaltoncaling2
Mathematics with nice undestand.pdf
Mathematics with nice undestand.pdfMathematics with nice undestand.pdf
Mathematics with nice undestand.pdf
elistemidayo
Mean, variance, and standard deviation of a Discrete Random Variable
Mean, variance, and standard deviation of a Discrete Random VariableMean, variance, and standard deviation of a Discrete Random Variable
Mean, variance, and standard deviation of a Discrete Random Variable
Michael Ogoy
PSUnit_I_Lesson_4_Computing_the_Variance_of_a_Discrete_Probability_Distributi...
PSUnit_I_Lesson_4_Computing_the_Variance_of_a_Discrete_Probability_Distributi...PSUnit_I_Lesson_4_Computing_the_Variance_of_a_Discrete_Probability_Distributi...
PSUnit_I_Lesson_4_Computing_the_Variance_of_a_Discrete_Probability_Distributi...
jaysongulla1
Machine Learning - Probability Distribution.pdf
Machine Learning - Probability Distribution.pdfMachine Learning - Probability Distribution.pdf
Machine Learning - Probability Distribution.pdf
Maleeshapathirana
Chapter 1 random variables and probability distributions
Chapter 1   random variables and probability distributionsChapter 1   random variables and probability distributions
Chapter 1 random variables and probability distributions
Antonio F. Balatar Jr.
Statistics and Probability-Random Variables and Probability Distribution
Statistics and Probability-Random Variables and Probability DistributionStatistics and Probability-Random Variables and Probability Distribution
Statistics and Probability-Random Variables and Probability Distribution
April Palmes
1.1 mean, variance and standard deviation
1.1 mean, variance and standard deviation1.1 mean, variance and standard deviation
1.1 mean, variance and standard deviation
ONE Virtual Services
MODULE-1-LESSON-3-MEAN-VARIANCE-AND-STANDARD-DEVIATION (2).pdf
MODULE-1-LESSON-3-MEAN-VARIANCE-AND-STANDARD-DEVIATION (2).pdfMODULE-1-LESSON-3-MEAN-VARIANCE-AND-STANDARD-DEVIATION (2).pdf
MODULE-1-LESSON-3-MEAN-VARIANCE-AND-STANDARD-DEVIATION (2).pdf
ClintIkn
Probability.pptx Powerpoint presentaionc
Probability.pptx Powerpoint presentaioncProbability.pptx Powerpoint presentaionc
Probability.pptx Powerpoint presentaionc
ChrisTian609473
LSCM 2072_chapter 1.ppt social marketing management
LSCM 2072_chapter 1.ppt social marketing managementLSCM 2072_chapter 1.ppt social marketing management
LSCM 2072_chapter 1.ppt social marketing management
DagimNegash1
understanding-key-concepts-of-probability-and-random-variables-through-exampl...
understanding-key-concepts-of-probability-and-random-variables-through-exampl...understanding-key-concepts-of-probability-and-random-variables-through-exampl...
understanding-key-concepts-of-probability-and-random-variables-through-exampl...
elistemidayo
Probability Models and Random Variables
Probability Models and Random VariablesProbability Models and Random Variables
Probability Models and Random Variables
pwheeles
Computing the Variance of a Discrete Probability Distribution.pptx
Computing the Variance of a Discrete Probability Distribution.pptxComputing the Variance of a Discrete Probability Distribution.pptx
Computing the Variance of a Discrete Probability Distribution.pptx
JohnReyLanguidoQuija
probalilty and STATistics - PowerPT.pptx
probalilty and STATistics - PowerPT.pptxprobalilty and STATistics - PowerPT.pptx
probalilty and STATistics - PowerPT.pptx
dans15pats

Recently uploaded (20)

Urban models for professional practice 03
Urban models for professional practice 03Urban models for professional practice 03
Urban models for professional practice 03
DanisseLoiDapdap
Effective_Communication_Skills_Presentation.pptx
Effective_Communication_Skills_Presentation.pptxEffective_Communication_Skills_Presentation.pptx
Effective_Communication_Skills_Presentation.pptx
patharlotadoo
14th International Conference on Advanced Computer Science and Information Te...
14th International Conference on Advanced Computer Science and Information Te...14th International Conference on Advanced Computer Science and Information Te...
14th International Conference on Advanced Computer Science and Information Te...
ijitcs
tinywow_Varia_PPT Leadership skills1_80706257.docx
tinywow_Varia_PPT Leadership skills1_80706257.docxtinywow_Varia_PPT Leadership skills1_80706257.docx
tinywow_Varia_PPT Leadership skills1_80706257.docx
abdulrhmansultanfa
Time series analysis & forecasting day 2.pptx
Time series analysis & forecasting day 2.pptxTime series analysis & forecasting day 2.pptx
Time series analysis & forecasting day 2.pptx
AsmaaMahmoud89
Red Hat Openshift Training - openshift (1).pptx
Red Hat Openshift Training - openshift (1).pptxRed Hat Openshift Training - openshift (1).pptx
Red Hat Openshift Training - openshift (1).pptx
ssuserf60686
03_10_gender_men_masculinity_reforms_policy.pdf
03_10_gender_men_masculinity_reforms_policy.pdf03_10_gender_men_masculinity_reforms_policy.pdf
03_10_gender_men_masculinity_reforms_policy.pdf
LucaMariaPesando1
Bringing data to life - Crime webinar Accessible.pptx
Bringing data to life - Crime webinar Accessible.pptxBringing data to life - Crime webinar Accessible.pptx
Bringing data to life - Crime webinar Accessible.pptx
Office for National Statistics
CRITICAL JURNAL KUANTITATIF KEPERAWATAN.pptx
CRITICAL JURNAL KUANTITATIF KEPERAWATAN.pptxCRITICAL JURNAL KUANTITATIF KEPERAWATAN.pptx
CRITICAL JURNAL KUANTITATIF KEPERAWATAN.pptx
monarisdaralina1
Unit 2 - Unified Modeling Language (UML).pdf
Unit 2 - Unified Modeling Language (UML).pdfUnit 2 - Unified Modeling Language (UML).pdf
Unit 2 - Unified Modeling Language (UML).pdf
sixokak391
hahehwhwhhwhwhwywtwtwywuwjwjwwnnwnensnsnsnsnsnsnsnnsnsndndndndndndndjdndndCou...
hahehwhwhhwhwhwywtwtwywuwjwjwwnnwnensnsnsnsnsnsnsnnsnsndndndndndndndjdndndCou...hahehwhwhhwhwhwywtwtwywuwjwjwwnnwnensnsnsnsnsnsnsnnsnsndndndndndndndjdndndCou...
hahehwhwhhwhwhwywtwtwywuwjwjwwnnwnensnsnsnsnsnsnsnnsnsndndndndndndndjdndndCou...
T207TrnVnt
Research presentations and statistics for computer science.pptx
Research presentations  and statistics for computer science.pptxResearch presentations  and statistics for computer science.pptx
Research presentations and statistics for computer science.pptx
vimbaimapfumo25
Time series analysis & forecasting-Day1.pptx
Time series analysis & forecasting-Day1.pptxTime series analysis & forecasting-Day1.pptx
Time series analysis & forecasting-Day1.pptx
AsmaaMahmoud89
Digital Disruption Use Case_Music Industry_for students.pdf
Digital Disruption Use Case_Music Industry_for students.pdfDigital Disruption Use Case_Music Industry_for students.pdf
Digital Disruption Use Case_Music Industry_for students.pdf
ProsenjitMitra9
463.8-Bitcoin from university of illinois
463.8-Bitcoin from university of illinois463.8-Bitcoin from university of illinois
463.8-Bitcoin from university of illinois
8gqtkfzwbb
PM003_SERENE-CM-PM-Training Material-EAM Maintenance Notification.pptx
PM003_SERENE-CM-PM-Training Material-EAM Maintenance Notification.pptxPM003_SERENE-CM-PM-Training Material-EAM Maintenance Notification.pptx
PM003_SERENE-CM-PM-Training Material-EAM Maintenance Notification.pptx
afriyanrtanjung007
2022.02.07_Bahan DJE Energy Transition Dialogue 2022 kirim.pdf
2022.02.07_Bahan DJE Energy Transition Dialogue 2022 kirim.pdf2022.02.07_Bahan DJE Energy Transition Dialogue 2022 kirim.pdf
2022.02.07_Bahan DJE Energy Transition Dialogue 2022 kirim.pdf
RomiRomeo
15 Data Quality Issues Identify & Resolve Errors.pdf
15 Data Quality Issues Identify & Resolve Errors.pdf15 Data Quality Issues Identify & Resolve Errors.pdf
15 Data Quality Issues Identify & Resolve Errors.pdf
AffinityCore
DEWDHDIEFHIFHIHGIERHFIHIM SC ID (2).pptx
DEWDHDIEFHIFHIHGIERHFIHIM SC ID (2).pptxDEWDHDIEFHIFHIHGIERHFIHIM SC ID (2).pptx
DEWDHDIEFHIFHIHGIERHFIHIM SC ID (2).pptx
f8jyv28tjr
Splunk_ITSI_Interview_Prep_Deck.pptx interview
Splunk_ITSI_Interview_Prep_Deck.pptx interviewSplunk_ITSI_Interview_Prep_Deck.pptx interview
Splunk_ITSI_Interview_Prep_Deck.pptx interview
willmorekanan
Urban models for professional practice 03
Urban models for professional practice 03Urban models for professional practice 03
Urban models for professional practice 03
DanisseLoiDapdap
Effective_Communication_Skills_Presentation.pptx
Effective_Communication_Skills_Presentation.pptxEffective_Communication_Skills_Presentation.pptx
Effective_Communication_Skills_Presentation.pptx
patharlotadoo
14th International Conference on Advanced Computer Science and Information Te...
14th International Conference on Advanced Computer Science and Information Te...14th International Conference on Advanced Computer Science and Information Te...
14th International Conference on Advanced Computer Science and Information Te...
ijitcs
tinywow_Varia_PPT Leadership skills1_80706257.docx
tinywow_Varia_PPT Leadership skills1_80706257.docxtinywow_Varia_PPT Leadership skills1_80706257.docx
tinywow_Varia_PPT Leadership skills1_80706257.docx
abdulrhmansultanfa
Time series analysis & forecasting day 2.pptx
Time series analysis & forecasting day 2.pptxTime series analysis & forecasting day 2.pptx
Time series analysis & forecasting day 2.pptx
AsmaaMahmoud89
Red Hat Openshift Training - openshift (1).pptx
Red Hat Openshift Training - openshift (1).pptxRed Hat Openshift Training - openshift (1).pptx
Red Hat Openshift Training - openshift (1).pptx
ssuserf60686
03_10_gender_men_masculinity_reforms_policy.pdf
03_10_gender_men_masculinity_reforms_policy.pdf03_10_gender_men_masculinity_reforms_policy.pdf
03_10_gender_men_masculinity_reforms_policy.pdf
LucaMariaPesando1
Bringing data to life - Crime webinar Accessible.pptx
Bringing data to life - Crime webinar Accessible.pptxBringing data to life - Crime webinar Accessible.pptx
Bringing data to life - Crime webinar Accessible.pptx
Office for National Statistics
CRITICAL JURNAL KUANTITATIF KEPERAWATAN.pptx
CRITICAL JURNAL KUANTITATIF KEPERAWATAN.pptxCRITICAL JURNAL KUANTITATIF KEPERAWATAN.pptx
CRITICAL JURNAL KUANTITATIF KEPERAWATAN.pptx
monarisdaralina1
Unit 2 - Unified Modeling Language (UML).pdf
Unit 2 - Unified Modeling Language (UML).pdfUnit 2 - Unified Modeling Language (UML).pdf
Unit 2 - Unified Modeling Language (UML).pdf
sixokak391
hahehwhwhhwhwhwywtwtwywuwjwjwwnnwnensnsnsnsnsnsnsnnsnsndndndndndndndjdndndCou...
hahehwhwhhwhwhwywtwtwywuwjwjwwnnwnensnsnsnsnsnsnsnnsnsndndndndndndndjdndndCou...hahehwhwhhwhwhwywtwtwywuwjwjwwnnwnensnsnsnsnsnsnsnnsnsndndndndndndndjdndndCou...
hahehwhwhhwhwhwywtwtwywuwjwjwwnnwnensnsnsnsnsnsnsnnsnsndndndndndndndjdndndCou...
T207TrnVnt
Research presentations and statistics for computer science.pptx
Research presentations  and statistics for computer science.pptxResearch presentations  and statistics for computer science.pptx
Research presentations and statistics for computer science.pptx
vimbaimapfumo25
Time series analysis & forecasting-Day1.pptx
Time series analysis & forecasting-Day1.pptxTime series analysis & forecasting-Day1.pptx
Time series analysis & forecasting-Day1.pptx
AsmaaMahmoud89
Digital Disruption Use Case_Music Industry_for students.pdf
Digital Disruption Use Case_Music Industry_for students.pdfDigital Disruption Use Case_Music Industry_for students.pdf
Digital Disruption Use Case_Music Industry_for students.pdf
ProsenjitMitra9
463.8-Bitcoin from university of illinois
463.8-Bitcoin from university of illinois463.8-Bitcoin from university of illinois
463.8-Bitcoin from university of illinois
8gqtkfzwbb
PM003_SERENE-CM-PM-Training Material-EAM Maintenance Notification.pptx
PM003_SERENE-CM-PM-Training Material-EAM Maintenance Notification.pptxPM003_SERENE-CM-PM-Training Material-EAM Maintenance Notification.pptx
PM003_SERENE-CM-PM-Training Material-EAM Maintenance Notification.pptx
afriyanrtanjung007
2022.02.07_Bahan DJE Energy Transition Dialogue 2022 kirim.pdf
2022.02.07_Bahan DJE Energy Transition Dialogue 2022 kirim.pdf2022.02.07_Bahan DJE Energy Transition Dialogue 2022 kirim.pdf
2022.02.07_Bahan DJE Energy Transition Dialogue 2022 kirim.pdf
RomiRomeo
15 Data Quality Issues Identify & Resolve Errors.pdf
15 Data Quality Issues Identify & Resolve Errors.pdf15 Data Quality Issues Identify & Resolve Errors.pdf
15 Data Quality Issues Identify & Resolve Errors.pdf
AffinityCore
DEWDHDIEFHIFHIHGIERHFIHIM SC ID (2).pptx
DEWDHDIEFHIFHIHGIERHFIHIM SC ID (2).pptxDEWDHDIEFHIFHIHGIERHFIHIM SC ID (2).pptx
DEWDHDIEFHIFHIHGIERHFIHIM SC ID (2).pptx
f8jyv28tjr
Splunk_ITSI_Interview_Prep_Deck.pptx interview
Splunk_ITSI_Interview_Prep_Deck.pptx interviewSplunk_ITSI_Interview_Prep_Deck.pptx interview
Splunk_ITSI_Interview_Prep_Deck.pptx interview
willmorekanan
Ad

STATISTICS - LESSON no 1 - MIDTERM-2.pdf

  • 1. LESSON 5: CALCULATING MEAN AND VARIANCE OF A DISCRETE RANDOM VARIABLE
  • 2. THE MEAN a. The average of all possible outcomes. It is otherwise referred to as the expected value of a probability distribution. b. Means that if we repeat any given experiment infinite times, the theoretical mean would be the expected value. c. Any discrete probability distribution has a mean.
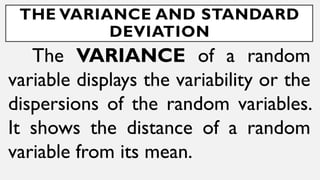
  • 3. THE VARIANCE AND STANDARD DEVIATION The VARIANCE of a random variable displays the variability or the dispersions of the random variables. It shows the distance of a random variable from its mean.
  • 4. THE VARIANCE AND STANDARD DEVIATION a. If the values of the variance and standard deviation are HIGH, that means that the individual outcomes of the experiment are far relative to each other. In other words, the values differ greatly. b. A large value of standard deviation (or variance) means that the distribution is spread out, with some possibility of observing values at some distance from the mean.
  • 5. THE VARIANCE AND STANDARD DEVIATION c. If the variance and standard deviation are LOW, that means that the individual outcomes of the experiment are closely spaced with each other. In other words, the values are almost the same values or if they do differ, the difference is small. d. A small value of standard deviation (or variance) means that the dispersion of the random variable is narrowly concentrated around the mean.
  • 6. Mean, variance, and standard deviation can be illustrated by looking pattern and analyzing given illustrations and diagrams.
  • 7. During Town Fiesta, people used to go to Carnival that most folks call it Perya. Mang Ben used to play Betobeto hoping that he would win. While he is thinking about what possible outcomes in every roll would be, he is always hoping that his bet is right. X 1 2 3 4 5 6 P(X) EXAMPLE
  • 8. 1.Is the probability of X lies between 0 and 1? 2.What is the sum of all probabilities of X? 3.Is there a negative probability? Is it possible to have a negative probability? 4.How will you illustrate the average or mean of the probabilities of discrete random variable? QUESTIONS:
  • 9. 1.Is the probability of x lies between 0 and 1? Yes, the probability of X lies between 0 and 1. X 1 2 3 4 5 6 P(X) SOLUTION:
  • 10. 2. What is the sum of all probabilities of X? 犒 = + + + + + = + + + + + = +++++ = The sum of all probabilities of X is exactly 1. X 1 2 3 4 5 6 P(X) SOLUTION:
  • 11. 3. Is there a negative probability? Is it possible to have a negative probability? No negative probabilities because it is impossible to have it based on the characteristic of the probability of discrete random variables. SOLUTION:
  • 12. In a seafood restaurant, the manager wants to know if their customers like their new raw large oysters. According to their sales representative, in the past 4 months, the number of oysters consumed by a customer, along with its corresponding probabilities, is shown in the succeeding table. Compute the mean, variance and standard deviation. Number of oysters consumed X Probabilit y P(X) 0 1 2 3 4 EXAMPLE 1
  • 13. (X) P(X) X P(X) . ( )族 ( )族 () 0 . . = . . = . . . = . 1 . 0.2 . = . . = . . . = . 2 . 0.6 . = . . = . . . = . 3 . 0.6 . = . . = . . . = . 4 . 0.4 4. = . . = . . . = .
  • 14. 1.What is the mean? = 犒[ ()] = + . + . + . + . = . SOLUTION:
  • 15. 2. What is the standard deviation? 2 = 犒 ( )族 () = 0.448 + 0.128 + 0.012 + 0.288 + 0.484 . SOLUTION:
  • 16. 3. What is the standard deviation? = ( )族 () = 2 = 1.56 = . SOLUTION:
  • 17. Mr. Umali, a Mathematics teacher, regularly gives a formative assessment composed of 5 multiple-choice items. After the assessment, he used to check the probability distribution of the correct responses, and the data is presented below: TEST ITEM (X) Probability () 0 0.03 1 0.05 2 0.12 3 0.30 4 0.28 5 0.22 EXAMPLE 2
  • 18. 1.What is the average or mean of the given probability distribution? 2.What are the values of the variance of the probability distribution? 3.What are the values of standard deviation of the probability distribution? QUESTIONS:
  • 19. X P(X) X P(X) X - (X - )族 (X - )族 P(X) 0 0.03 0 0.03 = 0 0 3.41 = 3.41 (3.41)族 = 11.63 11.63 . = . 1 0.05 1 0.05 = 0.05 1 3.41 = 2.41 (2.41)族 = 5.81 5. . = . 2 0.12 2 0.12 = 0.24 2 3.41 = 1.41 (1.41)族 = 1.99 1. . = . 3 0.30 3 0.30 = 0.90 3 3.41 = 0.41 (0.41)族 = 0.17 0. . = . 4 0.28 4 0.28 = 1.12 4 3.41 = 0.59 (0.59)族 = 0.35 0.35 . = . 5 0.22 5 0.22 = 1.10 5 3.41 = 1.59 (1.59)族 = 2.53 2.53 . = . = . = .
  • 20. 1.What is the mean? = 犒[ ()] = + . + . + . + . + . = . SOLUTION:
  • 21. 2. What is the standard deviation? 2 = 犒 ( )族 () = . + . + . + . + . + = . SOLUTION:
  • 22. 3. What is the standard deviation? = ( )族 () = 2 = 1.59 = . SOLUTION:
  • 23. 1. The number of shoes sold per day at a retail store is shown in the table below. Illustrate the mean, variance, and standard deviation of this distribution. Write all the necessary formula and show the complete solution. Formula to be used: (a)Mean, (b)Variance,(c) Standard Deviation X 19 20 21 22 23 P(X) 0.4 0.2 0.2 0.1 0.1 ACTIVITY 1
  • 24. 1. The Land Bank of the Philippines Manager claimed that each saving account customer has several credit cards. The following distribution showing the number of credits cards people own. a. Calculate the mean, variance, and standard deviation of a discrete random variable. X 0 1 2 3 4 P(X) 0.18 0.44 0.27 0.08 0.03 ASSIGNMENT
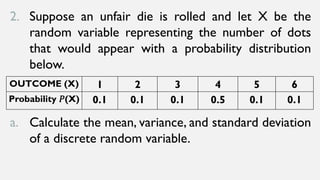
  • 25. 2. Suppose an unfair die is rolled and let X be the random variable representing the number of dots that would appear with a probability distribution below. a. Calculate the mean, variance, and standard deviation of a discrete random variable. OUTCOME (X) 1 2 3 4 5 6 Probability (X) 0.1 0.1 0.1 0.5 0.1 0.1
  • 26. 1. The number of cellular phones sold per day at the E-Cell Retail Store with the corresponding probabilities is shown in the table below. Compute the mean, variance, and standard deviation and interpret the result. () 15 18 19 20 22 Probability () 0.30 0.20 0.20 0.15 0.15