際際滷

際際滷Share a Scribd company logo
StocksQuest Online Stock Simulation Game
                              Lesson #8 Track and Graph Exercise

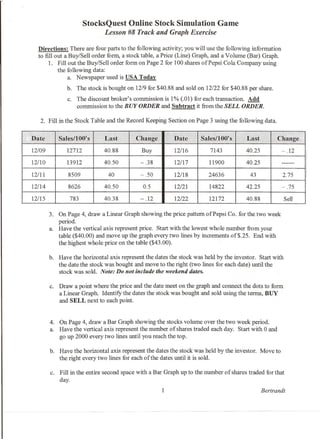
  Directions: There are four parts to the following activity; you will use the following information
  to fill out a Buy/Sell order form, a stock table, a Price (Line) Graph, and a Volume (Bar) Graph.
       1. Fill out the Buy/Sell order form on Page 2 for 100 shares of Pepsi Cola Company using
           the following data:
               a. Newspaper used is USA Today
               b. The stock is bought on 12/9 for $40.88 and sold on 12122 for $40.88 per share.
               c. The discount broker's commission is 1% (.01) for each transaction. Add
                  commission to the BUY ORDER and Subtract it from the SELL ORDER.

   2. Fill in the Stock Table and the Record Keeping Section on Page 3 using the following data.


                                                                                                   111揃illlll!~I~揃::!!揃i:揃I揃
12/09          12712          40.88          Buy          12116         7143           40.25             - .12

12/10          13912          40.50         -.38          12117         11900          40.25

12111          8509            40           - .50         12118         24636           43                2.75

12114          8626           40.50          0.5          12121         14822          42.25             -.75

12115           783           40.38         - .12         12122         12172          40.88               Sell

        3. On Page 4, draw a Linear Graph showing the price pattern of Pepsi Co. for the two week
           period.
        a. Have the vertical axis represent price. Start with the lowest whole number from your
           table ($40.00) and move up the graph every two lines by increments of$.25. End with
           the highest whole price on the table ($43.00).

        b. Have the horizontal axis represent the dates the stock was held by the investor. Start with
           the date the stock was bought and move to the right (two lines for each date) until the
           stock was sold. Note: Do not include the weekend dates.

        c. Draw a point where the price and the date meet on the graph and connect the dots to form
           a Linear Graph. Identify the dates the stock was bought and sold using the terms, BUY
           and SELL next to each point.


        4. On Page 4, draw a Bar Graph showing the stocks volume over the two week period.
        a. Have the vertical axis represent the number of shares traded each day. Start with 0 and
           go up 2000 every two lines until you reach the top.

        b. Have the horizontal axis represent the dates the stock was held by the investor. Move to
           the right every two lines for each of the dates until it is sold.

        c. Fill in the entire second space with a Bar Graph up to the number of shares traded for that
           day.
                                                     1                                         Bertrandt
BUY & SELL ORDER
                    Corporation Name:                    Newspaper:
              $

                                               Date:
             BUY                    Price Per Share:

                               # of Shares Bought:
                                               Price:
        ORDER                 Commission: (+ 1 %):

                                TOTAL BUY PRICE:

                    Buyers' Signatures:                  Broker's Signature:


                                                         Newspaper:
               $
             SELL                             Date:

        ORDER                      Price Per Share:

                                  # of. Shares Sold:

                                              Price: .

                              . Commission (-1 %):

                              TOTAL SELL PRICE:

                    Buyers' Signatures:                  Broker's Signature:


Record Keeping:

Buy Date:           Total Buy Price:

Sell Date:          Total Sell Price:

# of Days:          PROFITfLOSS:


                                                                      BertrandtBuySellOrder-mlr
IRACIilllG STOCK PRICE ~d VOLU11E - GRAPHS


                                          .   .-


                                                         ~.

                  . .. ... -:-t-+-+--t-t-I-+-+--+-..f-t--f-+-+-~-t-~t-t-+-+--+-+-~--1
                         t
                     .......
                         r-t-t--t--t-t-I-+-+--+-+-t--i--t-t--t--t--t-t-t-t--+-+-+-~-f
            ! .


    10..
             ::c
_._-<
             ~
             C
             Ul

             -
             U
             ell::
             Q.


I
STOCK TABLES
     - Company: __         ~                 ..,.--                               .


              Date

              Last

       .Net Change

            Volume


              Date.

              Last

           Net Change

            Volume

      5.       Basedon the graphs you've drawn and "the Buy/Sell Order, answer the following questions:
               a.     The stock was at its lowest on               at                 per share. "
               b.     The stock was at its highest on                   at               per share.
              c.      The stock was bought for a total of                     on                     _
              d.      The stock was sold for a total of                      on           --:-__
              e.      Was this a good investment? Why or why not?


              f.      Lightest trading was on               ; # of shares traded:                      _
              g.      Heaviest trading was on               ; # of shares traded:                        _


                                                                                                   Bertrandt5tockThls- ml r


,-
More Related Content

Stocks Quest Lesson 8a

  • 1. StocksQuest Online Stock Simulation Game Lesson #8 Track and Graph Exercise Directions: There are four parts to the following activity; you will use the following information to fill out a Buy/Sell order form, a stock table, a Price (Line) Graph, and a Volume (Bar) Graph. 1. Fill out the Buy/Sell order form on Page 2 for 100 shares of Pepsi Cola Company using the following data: a. Newspaper used is USA Today b. The stock is bought on 12/9 for $40.88 and sold on 12122 for $40.88 per share. c. The discount broker's commission is 1% (.01) for each transaction. Add commission to the BUY ORDER and Subtract it from the SELL ORDER. 2. Fill in the Stock Table and the Record Keeping Section on Page 3 using the following data. 111揃illlll!~I~揃::!!揃i:揃I揃 12/09 12712 40.88 Buy 12116 7143 40.25 - .12 12/10 13912 40.50 -.38 12117 11900 40.25 12111 8509 40 - .50 12118 24636 43 2.75 12114 8626 40.50 0.5 12121 14822 42.25 -.75 12115 783 40.38 - .12 12122 12172 40.88 Sell 3. On Page 4, draw a Linear Graph showing the price pattern of Pepsi Co. for the two week period. a. Have the vertical axis represent price. Start with the lowest whole number from your table ($40.00) and move up the graph every two lines by increments of$.25. End with the highest whole price on the table ($43.00). b. Have the horizontal axis represent the dates the stock was held by the investor. Start with the date the stock was bought and move to the right (two lines for each date) until the stock was sold. Note: Do not include the weekend dates. c. Draw a point where the price and the date meet on the graph and connect the dots to form a Linear Graph. Identify the dates the stock was bought and sold using the terms, BUY and SELL next to each point. 4. On Page 4, draw a Bar Graph showing the stocks volume over the two week period. a. Have the vertical axis represent the number of shares traded each day. Start with 0 and go up 2000 every two lines until you reach the top. b. Have the horizontal axis represent the dates the stock was held by the investor. Move to the right every two lines for each of the dates until it is sold. c. Fill in the entire second space with a Bar Graph up to the number of shares traded for that day. 1 Bertrandt
  • 2. BUY & SELL ORDER Corporation Name: Newspaper: $ Date: BUY Price Per Share: # of Shares Bought: Price: ORDER Commission: (+ 1 %): TOTAL BUY PRICE: Buyers' Signatures: Broker's Signature: Newspaper: $ SELL Date: ORDER Price Per Share: # of. Shares Sold: Price: . . Commission (-1 %): TOTAL SELL PRICE: Buyers' Signatures: Broker's Signature: Record Keeping: Buy Date: Total Buy Price: Sell Date: Total Sell Price: # of Days: PROFITfLOSS: BertrandtBuySellOrder-mlr
  • 3. IRACIilllG STOCK PRICE ~d VOLU11E - GRAPHS . .- ~. . .. ... -:-t-+-+--t-t-I-+-+--+-..f-t--f-+-+-~-t-~t-t-+-+--+-+-~--1 t ....... r-t-t--t--t-t-I-+-+--+-+-t--i--t-t--t--t--t-t-t-t--+-+-+-~-f ! . 10.. ::c _._-< ~ C Ul - U ell:: Q. I
  • 4. STOCK TABLES - Company: __ ~ ..,.-- . Date Last .Net Change Volume Date. Last Net Change Volume 5. Basedon the graphs you've drawn and "the Buy/Sell Order, answer the following questions: a. The stock was at its lowest on at per share. " b. The stock was at its highest on at per share. c. The stock was bought for a total of on _ d. The stock was sold for a total of on --:-__ e. Was this a good investment? Why or why not? f. Lightest trading was on ; # of shares traded: _ g. Heaviest trading was on ; # of shares traded: _ Bertrandt5tockThls- ml r ,-