Summary_Onset (1)
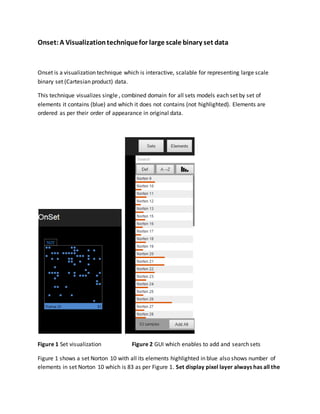
- 1. Onset:A Visualizationtechniquefor large scale binary set data Onset is a visualization technique which is interactive, scalable for representing large scale binary set (Cartesian product) data. This technique visualizes single , combined domain for all sets models each set by set of elements it contains (blue) and which it does not contains (not highlighted). Elements are ordered as per their order of appearance in original data. Figure 1 Set visualization Figure 2 GUI which enables to add and search sets Figure 1 shows a set Norton 10 with all its elements highlighted in blue also shows number of elements in set Norton 10 which is 83 as per Figure 1. Set display pixel layer always has all the
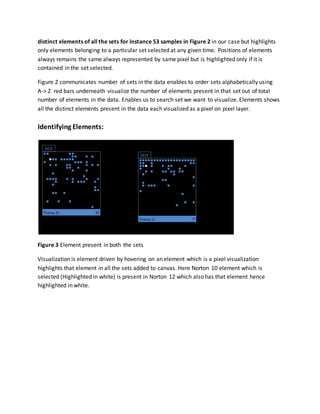
- 2. distinct elements of all the sets for instance 53 samples in Figure 2 in our case but highlights only elements belonging to a particular set selected at any given time. Positions of elements always remains the same always represented by same pixel but is highlighted only if it is contained in the set selected. Figure 2 communicates number of sets in the data enables to order sets alphabetically using A-> Z red bars underneath visualize the number of elements present in that set out of total number of elements in the data. Enables us to search set we want to visualize. Elements shows all the distinct elements present in the data each visualized as a pixel on pixel layer. Identifying Elements: Figure 3 Element present in both the sets Visualization is element driven by hovering on an element which is a pixel visualization highlights that element in all the sets added to canvas. Here Norton 10 element which is selected (Highlighted in white) is present in Norton 12 which also has that element hence highlighted in white.
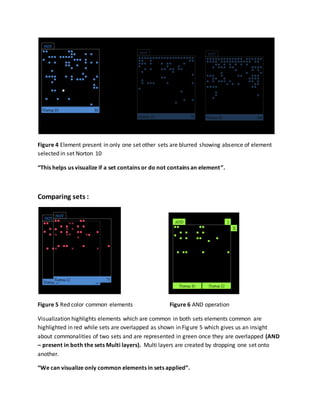
- 3. Figure 4 Element present in only one set other sets are blurred showing absence of element selected in set Norton 10 âThis helps us visualize if a set contains or do not contains an elementâ. Comparing sets : Figure 5 Red color common elements Figure 6 AND operation Visualization highlights elements which are common in both sets elements common are highlighted in red while sets are overlapped as shown in Figure 5 which gives us an insight about commonalities of two sets and are represented in green once they are overlapped (AND â present in both the sets Multi layers). Multi layers are created by dropping one set onto another. âWe can visualize only common elements in sets appliedâ.
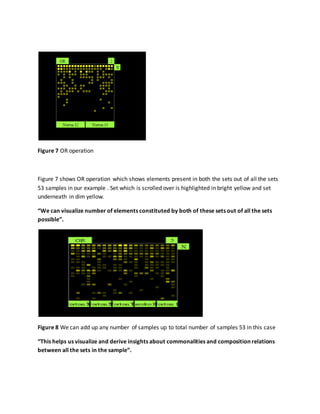
- 4. Figure 7 OR operation Figure 7 shows OR operation which shows elements present in both the sets out of all the sets 53 samples in our example . Set which is scrolled over is highlighted in bright yellow and set underneath in dim yellow. âWe can visualize number of elements constituted by both of these sets out of all the sets possibleâ. Figure 8 We can add up any number of samples up to total number of samples 53 in this case âThis helps us visualize and derive insights about commonalities and composition relations between all the sets in the sampleâ.
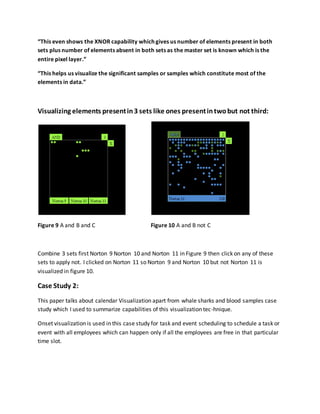
- 5. âThis even shows the XNOR capability which gives us number of elements present in both sets plus number of elements absent in both sets as the master set is known which is the entire pixel layer.â âThis helps us visualize the significant samples or samples which constitute most of the elements in data.â Visualizing elements presentin3 sets like ones presentintwobut not third: Figure 9 A and B and C Figure 10 A and B not C Combine 3 sets first Norton 9 Norton 10 and Norton 11 in Figure 9 then click on any of these sets to apply not. I clicked on Norton 11 so Norton 9 and Norton 10 but not Norton 11 is visualized in figure 10. Case Study 2: This paper talks about calendar Visualization apart from whale sharks and blood samples case study which I used to summarize capabilities of this visualization tec-hnique. Onset visualization is used in this case study for task and event scheduling to schedule a task or event with all employees which can happen only if all the employees are free in that particular time slot.
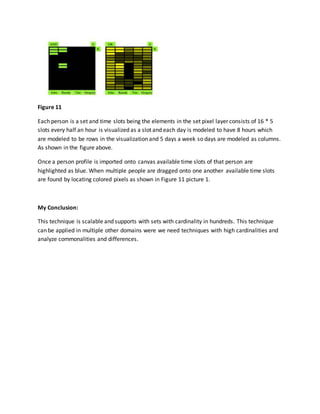
- 6. Figure 11 Each person is a set and time slots being the elements in the set pixel layer consists of 16 * 5 slots every half an hour is visualized as a slot and each day is modeled to have 8 hours which are modeled to be rows in the visualization and 5 days a week so days are modeled as columns. As shown in the figure above. Once a person profile is imported onto canvas available time slots of that person are highlighted as blue. When multiple people are dragged onto one another available time slots are found by locating colored pixels as shown in Figure 11 picture 1. My Conclusion: This technique is scalable and supports with sets with cardinality in hundreds. This technique can be applied in multiple other domains were we need techniques with high cardinalities and analyze commonalities and differences.