survey research
- 1. LOGO Principles of Survey Research Author:O. Tamimi An Najah National University
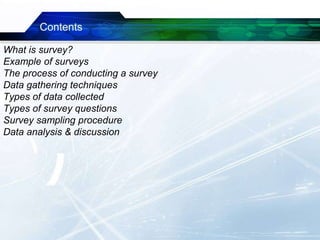
- 2. Contents What is survey? Example of surveys The process of conducting a survey Data gathering techniques Types of data collected Types of survey questions Survey sampling procedure Data analysis & discussion
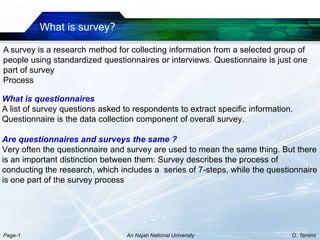
- 3. What is survey? A survey is a research method for collecting information from a selected group of people using standardized questionnaires or interviews. Questionnaire is just one part of survey Process What is questionnaires A list of survey questions asked to respondents to extract specific information. Questionnaire is the data collection component of overall survey. Are questionnaires and surveys the same ? Very often the questionnaire and survey are used to mean the same thing. But there is an important distinction between them: Survey describes the process of conducting the research, which includes a series of 7-steps, while the questionnaire is one part of the survey process Page-1 An Najah National University O. Tamimi
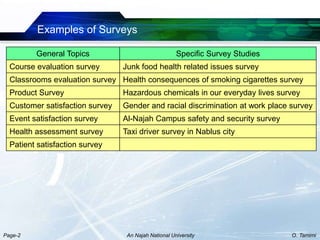
- 4. Examples of Surveys Page-2 An Najah National University O. Tamimi General Topics Specific Survey Studies Course evaluation survey Junk food health related issues survey Classrooms evaluation survey Health consequences of smoking cigarettes survey Product Survey Hazardous chemicals in our everyday lives survey Customer satisfaction survey Gender and racial discrimination at work place survey Event satisfaction survey Al-Najah Campus safety and security survey Health assessment survey Taxi driver survey in Nablus city Patient satisfaction survey
- 5. The process of conducting a survey Step-1: Defining the objective of the survey. It often comes from the thought âwhy I am doing this survey?â Step-2: Constructing the questionnaire, a well designed questionnaire can provide information about opinions, beliefs & practices of group of individuals Step-3: Methods of conducting the survey ï§ Decide about the procedure ï§ Sample size, how many people you will survey and their age ï§ How you will survey your subject(by phone, in class or interview) Step-4: Testing the questionnaire Find out if the questionnaireâs content is clear and consistent with the subject. Get some of your colleagues to review them Step-5: Administering the questionnaire in small study you can administer the questionnaire your self, but in large survey you will need helpers Step-6: Data entry and analysis statistical analysis is to be carried out Step-7: Writing the report The final stage of survey process is documenting the findings in a report Page-3 An Najah National University O. Tamimi
- 6. Page-4 An Najah National University O. Tamimi There are two main basic ways in which survey data are gathered: Interview based and Questionnaire based Data Gathering Techniques (Survey Classifications)
- 7. Hand Delivered Questionnaire (self completed questionnaire). The questionnaire is handed in person, the respondent will fill it up and submit it back to the researcher Advantage Less expensive compared with the face to face interview Disadvantage Limited opportunity for clarification if a respondent doesnât understand a question Web Questionnaire A collection of questions presented on a webpage and sent to the respondentâs email addresses. The survey design, distribution, completion and data analysis are done using through web-based applications Advantage Easy to administer, convenient for respondents Disadvantage Can be confused as SPAM Face to Face Interview (questionnaire is completed by the interviewer) The interviewer reads the questions in a face to face setting Advantage Interviewer is present to provide assistance Disadvantage High cost because it involves a lot of traveling and hiring interviewers Phone Interview Interviewers usually conducts a phone interview with the respondents. The survey questions and their answers are handled by the interviewer Advantage Large number of surveys can be acquired in a short time Disadvantage Requires a highly skilled interviewers Page-5 An Najah National University O. Tamimi
- 8. Face to Face Survey Telephone Survey Self Completed Questionnaire Web Questionnaire Turn Around Time Slow Fast Fast Fast Cost High Medium Low Very Low Interviewers Required Yes Yes No No Response Rate High Medium Low Low Characteristics of Data Gathering Techniques Page-6 An Najah National University O. Tamimi cost: refers to the overhead cost and travelling cost response rate: refers to the number of people who answered the questionnaire divided by the number of people in the sample Notes
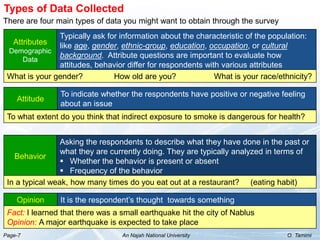
- 9. There are four main types of data you might want to obtain through the survey Types of Data Collected Attitude To indicate whether the respondents have positive or negative feeling about an issue Behavior Asking the respondents to describe what they have done in the past or what they are currently doing. They are typically analyzed in terms of ï§ Whether the behavior is present or absent ï§ Frequency of the behavior Opinion It is the respondentâs thought towards something Attributes Demographic Data Typically ask for information about the characteristic of the population: like age, gender, ethnic-group, education, occupation, or cultural background. Attribute questions are important to evaluate how attitudes, behavior differ for respondents with various attributes Fact: I learned that there was a small earthquake hit the city of Nablus Opinion: A major earthquake is expected to take place To what extent do you think that indirect exposure to smoke is dangerous for health? What is your gender? How old are you? What is your race/ethnicity? In a typical weak, how many times do you eat out at a restaurant? (eating habit) Page-7 An Najah National University O. Tamimi
- 10. Types of survey questions Open ended question: is a question at which there is no single answer.it actually gives the respondents the opportunity to answer using their own words, the answer could come in one sentence or more. Closed ended question: has a definite set of answers from which the respondent choses. closed ended question is easy to summarize, but it may take much more time to design. Closed ended questions have many different styles, these are: ïą Multiple choice question ïą Categorical question ïą Dichotomous question ïą Rank order question ïą Likert scale question (Matrix) Page-8 An Najah National University O. Tamimi Open ended question Closed ended question Advantage They permit adequate answers to complex questions It is easier to answer and easier to analyze Disadvantage A greater amount of respondents time, thought and effort is necessary Take more time to construct Example Why did you choose your major? Are you satisfied with your college?
- 11. Multiple Choice Question (single or multiple responses) The respondent is given a list of items and is asked to choose either one answer that best applies or multiple answers Types of multiple choice questions ï§ Radio buttons or check-boxes ï§ Drop-down ï§ Matrix Questions Categorical Question Example (single response using check-boxes) What is your opinion of the product you recently purchased? Excellent Good Poor Fair Used to categorize the respondents according to their age, gender, ethnic group or their level of education. 18-28 19-28 39-48 29-38 Which age range you are in: Example Page-9 An Najah National University O. Tamimi
- 12. Dichotomous Question Dichotomous questions are straight forward, typically asking respondents to choose between Yes / No Agree or Disagree True/False Have you ever purchased a product or service from our website? Yes No Example Rank order question Rank order questions allow a certain set of brands or products to be ranked based upon a specific characteristic. Such as; cost, usage, reliability or features Example Based upon what you have heard or experienced, please rank the following car brands according to their reliability. 2 Honda 4 Toyota 1 Mazda 3 Ford Page-10 An Najah National University O. Tamimi
- 13. Likert scale question (Matrix) Strongly Disagree Disagree Neutral Agree Strongly Agree I do not understand the concept behind the Lab experiment â I like labs where I get a full help in doing the experiments â It was clear how the Lab experiments fit into this course â The lab manual for this course was well written â Tick one box to indicate your agreement or disagreement with each statement Example It allows the respondents to rate a specific question on a scale of choices from i.e. strongly-agree to strongly-disagree. These choices are shown horizontally by default Page-11 An Najah National University O. Tamimi
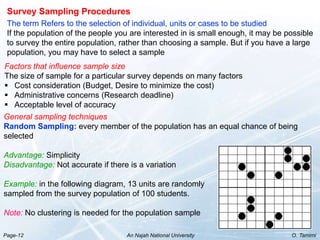
- 14. Survey Sampling Procedures General sampling techniques Random Sampling: every member of the population has an equal chance of being selected Advantage: Simplicity Disadvantage: Not accurate if there is a variation Example: in the following diagram, 13 units are randomly sampled from the survey population of 100 students. Note: No clustering is needed for the population sample The term Refers to the selection of individual, units or cases to be studied If the population of the people you are interested in is small enough, it may be possible to survey the entire population, rather than choosing a sample. But if you have a large population, you may have to select a sample Factors that influence sample size The size of sample for a particular survey depends on many factors ï§ Cost consideration (Budget, Desire to minimize the cost) ï§ Administrative concerns (Research deadline) ï§ Acceptable level of accuracy Page-12 An Najah National University O. Tamimi
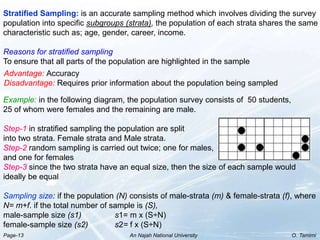
- 15. Stratified Sampling: is an accurate sampling method which involves dividing the survey population into specific subgroups (strata), the population of each strata shares the same characteristic such as; age, gender, career, income. Reasons for stratified sampling To ensure that all parts of the population are highlighted in the sample Example: in the following diagram, the population survey consists of 50 students, 25 of whom were females and the remaining are male. Step-1 in stratified sampling the population are split into two strata. Female strata and Male strata. Step-2 random sampling is carried out twice; one for males, and one for females Step-3 since the two strata have an equal size, then the size of each sample would ideally be equal Sampling size: if the population (N) consists of male-strata (m) & female-strata (f), where N= m+f. if the total number of sample is (S), male-sample size (s1) s1= m x (S÷N) female-sample size (s2) s2= f x (S÷N) Advantage: Accuracy Disadvantage: Requires prior information about the population being sampled Page-13 An Najah National University O. Tamimi
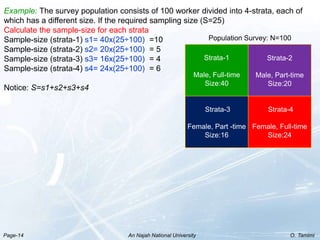
- 16. Strata-1 Male, Full-time Size:40 Strata-2 Male, Part-time Size:20 Strata-3 Female, Part -time Size:16 Strata-4 Female, Full-time Size:24 Population Survey: N=100 Example: The survey population consists of 100 worker divided into 4-strata, each of which has a different size. If the required sampling size (S=25) Calculate the sample-size for each strata Sample-size (strata-1) s1= 40x(25÷100) =10 Sample-size (strata-2) s2= 20x(25÷100) = 5 Sample-size (strata-3) s3= 16x(25÷100) = 4 Sample-size (strata-4) s4= 24x(25÷100) = 6 Notice: S=s1+s2+s3+s4 Page-14 An Najah National University O. Tamimi
- 17. Data Analysis & Discussion Once the questionnaires are completed and collected, the first step is to interpret the data on excel sheet to create specific drawings or charts. A questionnaire usually comes with a collection of closed ended questions like: multiple choices and scaled matrix questions. For easier analysis each item in these questions is converted into numerical value For example: The scaled question (e.g. strongly agree, agree, neutral, disagree & strongly disagree) shall be converted to these values (1,2,3,4,5) Strongly Disagree Disagree Neutral Agree Strongly Agree I do not understand the concept behind the Lab experiment â I like labs where I get a full help in doing the experiments â It was clear how the Lab experiments fit into this course â The lab manual for this course was well written â Page-15 An Najah National University O. Tamimi
- 18. Questions Strongly Agree Agree Neutral Disagree Strongly Disagree 1st Question 4 16 5 2 3 2nd Question 3 5 2 4 16 3rd Question 2 3 16 4 5 4th Question 16 5 4 3 3 Example: let us assume that the scaled question has been answered by a selected sample of 30 students. The studentâs responses per question are presented in table-1. The response rate in this case is 100% because all of the students have participated in answering the survey questions 1st Question Numerical Value Responses Strongly Agree 1 4 Agree 2 16 Neutral 3 5 Disagree 4 2 Strongly Disagree 5 3 Table-1 Table-2 Table-2 is extracted from table-1 to show how the students feel about the 1st question Page-16 An Najah National University O. Tamimi
- 19. 4 16 5 2 3 0 2 4 6 8 10 12 14 16 18 1 2 3 4 5 Responses Options of Question-1 Question-1 Options relative to Responses It is clearly noticed that nearly half of students have chose option-2, which means that they have no clear understanding of the concept behind LAB experiments, while the others indicate that there some degree of understanding. The variation of responses is attributed to two factors; 1st factor: no adequate preparation nor pre-lab questions were solved. 2nd factor: tutor shall dedicate half an hour time to explain the theoretical concepts prior each LAB Fig.1 The chart investigates the correlation of student responses on question-1 Discussion Page-17 An Najah National University O. Tamimi
- 22. References and Further Reading http://betterevaluation.org/evaluation-options/stratifiedrandom https://www.roadsafetyevaluation.com/evaluationtopics/researchmethods/sampling.html http://www.fao.org/docrep/004/y2790e/y2790e05.htm http://www.statisticalconsultants.co.nz/weeklyfeatures/WF7.html http://www.britannica.com/EBchecked/topic/564172/statistics http://home.ubalt.edu/ntsbarsh/stat-data/Surveys.htm#rssm http://www.statpac.com/surveys/sampling.htm http://www.sciencebuddies.org/science-fair-projects/project_ideas/Soc_survey.shtml http://www.socialresearchmethods.net/kb/survey.php http://www.accesscable.net/~infopoll/tips.htm http://www.surveysystem.com/sdesign.htm http://asq.org/learn-about-quality/data-collection-analysis-tools/overview/survey.html http://www.sciencebuddies.org/science-fair-projects/project_ideas/Soc_survey.shtml Page-20 An Najah National University O. Tamimi
- 23. http://web.njcu.edu/sites/faculty/kivy/Uploads/survey_research.pdf References and Further Reading https://www.roadsafetyevaluation.com/evaluationtopics/info/tecniques-for-selecting- samples.pdf http://www.aapor.org/AM/Template.cfm?Section=Cell_Phone_Task_Force_Report&Temp late=/CM/ContentDisplay.cfm&ContentID=3189 Robert M. (2009). Survey methodology. 2nd edition. USA:Wiley. 488 pages http://www.who.int/chp/steps/Part4.pdf#page=6&zoom=130,0,820 Page-21 An Najah National University O. Tamimi


