Swaay butterfly monitoring analysis
1 like541 views

Volunteers across Europe monitor butterfly populations by regularly counting butterflies along fixed transect routes. Over 200,000 records are collected annually in the Netherlands alone. Trend data from thousands of transects are analyzed to produce indicators of butterfly population changes over time. The data meet scientific standards and can measure progress towards conservation targets. Monitoring began in the UK in 1976 and now involves over 2,500 transects in 14 countries. The results are used to study relationships between butterflies and their habitat needs and environmental factors.


More Related Content
Similar to Swaay butterfly monitoring analysis (20)
Recently uploaded (20)


Swaay butterfly monitoring analysis
- 1. Butterfly Monitoring: analysis and scientific use of data Chris van Swaay, De Vlinderstichting / Dutch Butterfly Conservation Butterfly Conservation Europe (BCE) Statistics Netherlands (CBS) Thousands of volunteers Adapted by Martin Wiemers (UFZ, BCE)
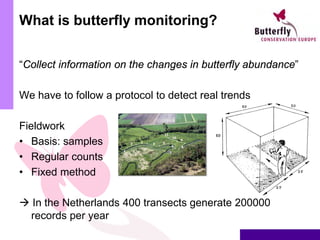
- 2. What is butterfly monitoring? ŌĆ£Collect information on the changes in butterfly abundanceŌĆØ We have to follow a protocol to detect real trends Fieldwork ŌĆó Basis: samples ŌĆó Regular counts ŌĆó Fixed method ’āĀ In the Netherlands 400 transects generate 200000 records per year
- 3. Products 10 100 1000 1992 1994 1996 1998 2000 2002 2004 Woodland generalists Woodland specialists Species trends Indicators 10 100 1000 1992 1994 1996 1998 2000 2002 2004 2006 2008 GeelsprietdikkopjeThymelicus sylvestris
- 4. Criteria for indicators ŌĆó Scientific sound method ŌĆó Sensitive ŌĆó Affordable monitoring, available and routinely collected data ŌĆó Spatial and temporal coverage of data ŌĆó Measure progress towards target ŌĆó Policy relevance ŌĆó Broad acceptance
- 5. The start ŌĆó Ernie Pollard started the first BMS in the UK in 1976
- 6. ŌĆó 1976: start of the first Butterfly Monitoring Scheme in the UK ŌĆó Well founded by many scientific papers ŌĆó Now at least 2500 transects in 14 countries ŌĆó Every year our European volunteers count once around the world (40.000 km)! Butterfly Monitoring available and routinely collected
- 7. Butterfly Monitoring Spatial coverage ŌĆó New countries join in every year ŌĆó Most of them done every year
- 8. Butterfly Monitoring Temporal coverage 0 2 4 6 8 10 12 14 16 18 20 1975 1980 1985 1990 1995 2000 2005 2010 NumberofBMS
- 9. From transects to European indicator ŌĆó Location of the transects ŌĆó Quality of the observer ŌĆó Quality of the observations ŌĆó Validation of the observations ŌĆó Calculating trends ŌĆó Building indicators
- 10. From transects to European indicator ŌĆó Location of the transects ŌĆó Quality of the observer ŌĆó Quality of the observations ŌĆó Validation of the observations ŌĆó Calculating trends ŌĆó Building indicators
- 11. Choice of locations ŌĆó Free choice of transects (e.g. in the UK, Netherlands, Germany) ŌĆō Pro: appealing to volunteers, easy to keep them motivated, rare species included ŌĆō Con: data is biased (but can be corrected by weighting) ŌĆó (Partly) random (e.g. France) ŌĆō Pro: less bias ŌĆō Con: sometimes transects on unattractive sites, no trends of rare species (often the ones with high conservation value) ŌĆó Regular grid (e.g. Switzerland) ŌĆō Pro: almost no bias ŌĆō Con: hard to achieve (only on professional basis); no trends of rare species (often the ones with high conservation value)
- 14. From transects to European indicator ŌĆó Location of the transects ŌĆó Quality of the observer ŌĆó Quality of the observations ŌĆó Validation of the observations ŌĆó Calculating trends ŌĆó Building indicators
- 15. Basic idea ŌĆó We realise we canŌĆÖt count all butterflies ŌĆó But by taking samples we can estimate trends ŌĆó As a consequence we donŌĆÖt know the population size ŌĆó But we can calculate changes in the population size efficiently ŌĆó With random or grid sampling transects are properly distributed over the country ŌĆó But in many countries recorders have a free choice ŌĆó Solution: weighting
- 16. Why weighting? ŌĆó Not all species are equally distributed over the country ŌĆó Not all transects are equally distributed over the country. In the Netherlands especially the dunes are ŌĆśoversampledŌĆÖ, agricultural areas in the clay and peat regions are ŌĆśundersampledŌĆÖ.
- 17. Weighting by Dutch physical geographic region and main habitat type Habitat types: ŌĆó Woodland ŌĆó Heathland ŌĆó Agriculture ŌĆó Open dunes ŌĆó Urban ŌĆó Moorland
- 18. Distribution of the population over the strata The distribution of each species per stratum is calculated. For example: Hipparchia semele Dunes - mainland Dunes - Waddensea Heathland - north Heathland - centre Heathland - south
- 19. Distribution of the transects over the strata Dunes- mainland Dunes- Waddensea Heathland- north Heathland- centre Heathland- south distribution
- 20. Big difference between weighted and unweighted indexes 1 10 100 1992 1994 1996 1998 2000 2002 2004 2006 Weighted Unweighted
- 21. The trend in the dunes is different from the trend on the heathlands distribution transects 1 10 100 1000 1990 1993 1996 1999 2002 2005 Heathland Coastal dunes
- 22. From transects to European indicator ŌĆó Location of the transects ŌĆó Quality of the observer ŌĆó Quality of the observations ŌĆó Validation of the observations ŌĆó Calculating trends ŌĆó Building indicators
- 23. Grassland Butterfly Indicator: main habitat for European butterflies ŌĆó For 57% of the species, grasslands are their main habitat. Grassland; 280 Woodland and scrub; 153 Heath, bog and fen; 25 others; 31
- 24. 17 species make the indicator ŌĆó 7 widespread species: Ochlodes sylvanus, Anthocharis cardamines, Lycaena phlaeas, Polyommatus icarus, Lasiommata megera, Coenonympha pamphilus Maniola jurtina ŌĆó 10 specialist species: Erynnis tages, Thymelicus acteon, Spialia sertorius, Cupido minimus, Maculinea arion, Maculinea nausithous, Polyommatus bellargus, Cyaniris semiargus, Polyommatus coridon Euphydryas aurinia
- 25. From national trends to a European trend 0 25 50 75 100 125 150 175 1990 1994 1998 2002 2006 2010 Index(firstyear=100) France The Netherlands Spain - Catalonia United Kingdom 0 20 40 60 80 100 120 1990 1994 1998 2002 2006 2010 Index(1990=100) + 9 other countries
- 26. European species trends 0 20 40 60 80 100 120 1990 1994 1998 2002 2006 2010 Index(1990=100) 0 20 40 60 80 100 120 140 160 1990 1994 1998 2002 2006 2010 Index(1990=100) 0 50 100 150 200 250 1990 1994 1998 2002 2006 2010 Index(1990=100)
- 27. European trends Species Trend in Europe Trend in EU Phengaris nausithous decline decline Erynnis tages decline decline Lasiommata megera decline decline Lycaena phlaeas decline decline Thymelicus acteon decline decline Ochlodes sylvanus decline decline Coenonympha pamphilus decline decline Cupido minimus decline decline Anthocharis cardamines decline stable Polyommatus icarus decline stable Maniola jurtina stable stable Polyommatus coridon stable stable Cyaniris semiargus uncertain stable Polyommatus bellargus uncertain uncertain Spialia sertorius uncertain uncertain Euphydryas aurinia uncertain uncertain Phengaris arion uncertain uncertain
- 28. European Grassland Butterfly Indicator 0 20 40 60 80 100 120 140 1990 1994 1998 2002 2006 2010 Butterfly Conservation Europe / Statistics Netherlands
- 33. Relationships between butterflies and environmental indicators ŌĆó Plants: Ellenberg values ŌĆó Like plants some species have a preference for rich or wet situations, others for poor or dry places ŌĆó Butterfly monitoring gave us info on the presence of butterflies ŌĆó We made vegetation surveys at transects and calculated the average Ellenberg value for Nutrient, acidity and moisture.
- 34. Field data of occurrence of a species vs soil pH
- 35. Logistic regression: sigmoid relationship
- 36. Logistic regression: gaussian relationship
- 37. 0 10 20 30 40 50 60 0 1 2 3 4 5 6 7 8 9 Probabilityofoccurrence(%) Acidity-value (Ellenberg scale) Pmax=37% Tolerance=2.3 Optimum=5.0 Response curve of Araschnia levana for EllenbergŌĆÖs acidity- value, showing the Optimum (U), the maximum probability of occurrence (Pmax) and the Tolerance (T).
- 38. 0 20 40 60 80 0 2 4 6 8 10 Prob/Freqofoccurrence(%) Nutrient-value (Ellenberg scale) (a) observed expected 0 20 40 60 80 0 2 4 6 8 10Prob/Freqofoccurrence(%) Nutrient-value (Ellenberg scale) (b) observed expected Two examples of response curves of butterflies on EllenbergŌĆÖs nutrient value, showing the calculated logistic regression model (expected) and the observed frequency of the species in the relev├®s falling in nutrient value classes with a width of 0.25: (a) the unimodal (Gaussian) response of Thymelicus lineola and (b) the sigmoidal response of Ochlodes sylvanus.
- 39. 0 20 40 60 80 100 0 5 10 Probabilityofoccurrence(%) Nutrient-value (Ellenberg-scale) (a) M. alcon A. levana C. selene P. icarus P. rapae
- 40. 0 20 40 60 0 5 10 Probabilityofoccurrence(%) Acidity-value (Ellenberg-scale) (b) C. tullia I. io E. tages A. agestis C. pamphilus
- 41. 0 20 40 60 0 5 10 Probabilityofoccurrence(%) Moisture-value (Ellenberg-scale) (c) V. optilete M. alcon E. tages I. lathonia L. megera
- 42. Use butterfly monitoring results for site information 0 1 2 3 4 5 6 7 8 1990 1995 2000 2005 2010 Moisture/Nitrogenvalue Moisture index Nitrogen index Luttenbergerven
- 43. Multiple relationships ŌĆó Give the relationship between the three indicators ŌĆó When more than one is significant, we get a multi- dimensional plane or surface ŌĆó For a site it can give an insight in the effects of a changing environment on butterflies
- 44. Calculate national annual nitrogen index for butterflies 5.7 5.8 5.9 6 6.1 6.2 6.3 6.4 6.5 1990 1995 2000 2005 2010 CNI
- 45. Calculate national annual nitrogen index for butterflies y = 0.0131x - 20.205 5.7 5.8 5.9 6 6.1 6.2 6.3 6.4 6.5 1990 1995 2000 2005 2010 CNI
- 46. De Vlinderstichting Dutch Butterfly Conservation www.vlinderstichting.nl Statistics Netherlands www.cbs.nl