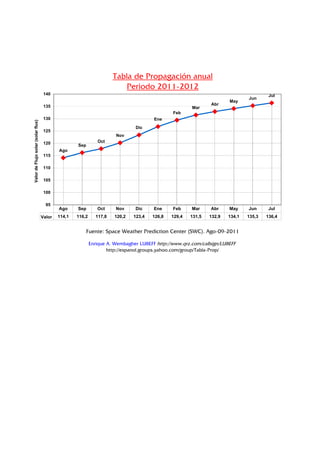
The document shows a table displaying the annual solar flux values from August 2011 to July 2012, with values ranging from 114.1 to 136.4. The highest solar flux values occurred from December to July, peaking in July 2012 at 136.4, while the lowest values were from August to November 2011, bottoming out at 114.1 in August 2011. The data comes from the Space Weather Prediction Center and is presented on a website by amateur radio operator Enrique A. Wembagher.
1 of 1
Download to read offline
More Related Content
Tabla anual 2011 2012
1. Tabla de Propagaci坦n anual
Periodo 2011-2012
140 Jul
Jun
May
135 Abr
Mar
Feb
130 Ene
Valor de Flujo solar (solar flux)
Dic
125
Nov
120 Oct
Sep
Ago
115
110
105
100
95
Ago Sep Oct Nov Dic Ene Feb Mar Abr May Jun Jul
Valor 114,1 116,2 117,8 120,2 123,4 126,8 129,4 131,5 132,9 134,1 135,3 136,4
Fuente: Space Weather Prediction Center (SWC). Ago-09-2011
Enrique A. Wembagher LU8EFF http://www.qrz.com/callsign/LU8EFF
http://espanol.groups.yahoo.com/group/Tabla-Prop/