Tablas normal chi cuadrado y t student 1-semana 6
Download as DOC, PDF1 like2,045 views

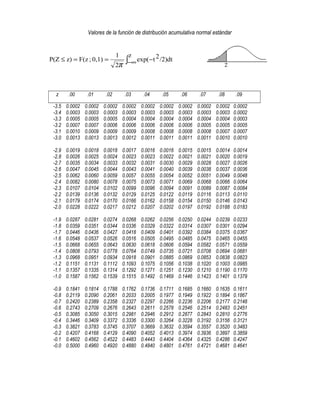
The document contains a table of values for the standard normal cumulative distribution function F(z) for z-values ranging from -3.5 to 3.2 in increments of 0.1. The table provides the probability P(ZŌēżz) for finding a value less than or equal to z in a standard normal distribution.
![valores de cuantiles de la distribuci├│n t de Student
[ ] ╬▒1dt
1)/2(Žģ
)/Žģ2(t1
/2)T(
1)/2(T
),1tP(T
Žģ╬▒,1t
ŽģŽĆŽģ
Žģ
Žģ╬▒ ŌłÆ=ŌłÆŌł×
+ŌłÆ
’Ż║’Ż╗
’Ż╣
’Ż»’Ż░
’Ż« +
+
=ŌłÆ< Ōł½
ŌłÆ
Žģ t0.800 t0.900 t0.950 t0.975 t0.990 t0.995 t0.999
1 1.376 3.078 6.314 12.706 31.820 63.656 318.294
2 1.061 1.886 2.920 4.303 6.965 9.925 22.327
3 0.978 1.638 2.353 3.182 4.541 5.841 10.214
4 0.941 1.533 2.132 2.776 3.747 4.604 7.173
5 0.920 1.476 2.015 2.571 3.365 4.032 5.893
6 0.906 1.440 1.943 2.447 3.143 3.707 5.208
7 0.896 1.415 1.895 2.365 2.998 3.499 4.785
8 0.889 1.397 1.860 2.306 2.896 3.355 4.501
9 0.883 1.383 1.833 2.262 2.821 3.250 4.297
10 0.879 1.372 1.812 2.228 2.764 3.169 4.144
11 0.876 1.363 1.796 2.201 2.718 3.106 4.025
12 0.873 1.356 1.782 2.179 2.681 3.055 3.930
13 0.870 1.350 1.771 2.160 2.650 3.012 3.852
14 0.868 1.345 1.761 2.145 2.624 2.977 3.787
15 0.866 1.341 1.753 2.131 2.602 2.947 3.733
16 0.865 1.337 1.746 2.120 2.583 2.921 3.686
17 0.863 1.333 1.740 2.110 2.567 2.898 3.646
18 0.862 1.330 1.734 2.101 2.552 2.878 3.610
19 0.861 1.328 1.729 2.093 2.539 2.861 3.579
20 0.860 1.325 1.725 2.086 2.528 2.845 3.552
21 0.859 1.323 1.721 2.080 2.518 2.831 3.527
22 0.858 1.321 1.717 2.074 2.508 2.819 3.505
23 0.858 1.319 1.714 2.069 2.500 2.807 3.485
24 0.857 1.318 1.711 2.064 2.492 2.797 3.467
25 0.856 1.316 1.708 2.060 2.485 2.787 3.450
26 0.856 1.315 1.706 2.056 2.479 2.779 3.435
27 0.855 1.314 1.703 2.052 2.473 2.771 3.421
28 0.855 1.313 1.701 2.048 2.467 2.763 3.408
29 0.854 1.311 1.699 2.045 2.462 2.756 3.396
30 0.854 1.310 1.697 2.042 2.457 2.750 3.385
35 0.852 1.306 1.690 2.030 2.438 2.724 3.340
40 0.851 1.303 1.684 2.021 2.423 2.704 3.307
45 0.850 1.301 1.679 2.014 2.412 2.690 3.281
50 0.849 1.299 1.676 2.009 2.403 2.678 3.261
60 0.848 1.296 1.671 2.000 2.390 2.660 3.232
70 0.847 1.294 1.667 1.994 2.381 2.648 3.211
80 0.846 1.292 1.664 1.990 2.374 2.639 3.195
90 0.846 1.291 1.662 1.987 2.368 2.632 3.183
100 0.845 1.290 1.660 1.984 2.364 2.626 3.174
200 0.843 1.286 1.652 1.972 2.345 2.601 3.131
500 0.842 1.283 1.648 1.965 2.334 2.586 3.107
1000 0.842 1.282 1.646 1.962 2.330 2.581 3.098](https://image.slidesharecdn.com/tablasnormalchicuadradoyt-student1semana6-170328122925/85/Tablas-normal-chi-cuadrado-y-t-student-1-semana-6-3-320.jpg)


![Tablas de fisher[1]](https://cdn.slidesharecdn.com/ss_thumbnails/tablasdefisher1-100513024343-phpapp02-thumbnail.jpg?width=560&fit=bounds)


More Related Content
What's hot (20)


Similar to Tablas normal chi cuadrado y t student 1-semana 6 (20)


Recently uploaded (20)


Tablas normal chi cuadrado y t student 1-semana 6
- 1. Valores de la funci├│n de distribuci├│n acumulativa normal est├Īndar Ōł½ŌłÆŌł× ŌłÆ==Ōēż z /2)dt2texp( 2 1 0,1);F(zz)P(Z ŽĆ z .00 .01 .02 .03 .04 .05 .06 .07 .08 .09 -3.5 0.0002 0.0002 0.0002 0.0002 0.0002 0.0002 0.0002 0.0002 0.0002 0.0002 -3.4 0.0003 0.0003 0.0003 0.0003 0.0003 0.0003 0.0003 0.0003 0.0003 0.0002 -3.3 0.0005 0.0005 0.0005 0.0004 0.0004 0.0004 0.0004 0.0004 0.0004 0.0003 -3.2 0.0007 0.0007 0.0006 0.0006 0.0006 0.0006 0.0006 0.0005 0.0005 0.0005 -3.1 0.0010 0.0009 0.0009 0.0009 0.0008 0.0008 0.0008 0.0008 0.0007 0.0007 -3.0 0.0013 0.0013 0.0013 0.0012 0.0011 0.0011 0.0011 0.0011 0.0010 0.0010 -2.9 0.0019 0.0018 0.0018 0.0017 0.0016 0.0016 0.0015 0.0015 0.0014 0.0014 -2.8 0.0026 0.0025 0.0024 0.0023 0.0023 0.0022 0.0021 0.0021 0.0020 0.0019 -2.7 0.0035 0.0034 0.0033 0.0032 0.0031 0.0030 0.0029 0.0028 0.0027 0.0026 -2.6 0.0047 0.0045 0.0044 0.0043 0.0041 0.0040 0.0039 0.0038 0.0037 0.0036 -2.5 0.0062 0.0060 0.0059 0.0057 0.0055 0.0054 0.0052 0.0051 0.0049 0.0048 -2.4 0.0082 0.0080 0.0078 0.0075 0.0073 0.0071 0.0069 0.0068 0.0066 0.0064 -2.3 0.0107 0.0104 0.0102 0.0099 0.0096 0.0094 0.0091 0.0089 0.0087 0.0084 -2.2 0.0139 0.0136 0.0132 0.0129 0.0125 0.0122 0.0119 0.0116 0.0113 0.0110 -2.1 0.0179 0.0174 0.0170 0.0166 0.0162 0.0158 0.0154 0.0150 0.0146 0.0143 -2.0 0.0228 0.0222 0.0217 0.0212 0.0207 0.0202 0.0197 0.0192 0.0188 0.0183 -1.9 0.0287 0.0281 0.0274 0.0268 0.0262 0.0256 0.0250 0.0244 0.0239 0.0233 -1.8 0.0359 0.0351 0.0344 0.0336 0.0329 0.0322 0.0314 0.0307 0.0301 0.0294 -1.7 0.0446 0.0436 0.0427 0.0418 0.0409 0.0401 0.0392 0.0384 0.0375 0.0367 -1.6 0.0548 0.0537 0.0526 0.0516 0.0505 0.0495 0.0485 0.0475 0.0465 0.0455 -1.5 0.0668 0.0655 0.0643 0.0630 0.0618 0.0606 0.0594 0.0582 0.0571 0.0559 -1.4 0.0808 0.0793 0.0778 0.0764 0.0749 0.0735 0.0721 0.0708 0.0694 0.0681 -1.3 0.0968 0.0951 0.0934 0.0918 0.0901 0.0885 0.0869 0.0853 0.0838 0.0823 -1.2 0.1151 0.1131 0.1112 0.1093 0.1075 0.1056 0.1038 0.1020 0.1003 0.0985 -1.1 0.1357 0.1335 0.1314 0.1292 0.1271 0.1251 0.1230 0.1210 0.1190 0.1170 -1.0 0.1587 0.1562 0.1539 0.1515 0.1492 0.1469 0.1446 0.1423 0.1401 0.1379 -0.9 0.1841 0.1814 0.1788 0.1762 0.1736 0.1711 0.1685 0.1660 0.1635 0.1611 -0.8 0.2119 0.2090 0.2061 0.2033 0.2005 0.1977 0.1949 0.1922 0.1894 0.1867 -0.7 0.2420 0.2389 0.2358 0.2327 0.2297 0.2266 0.2236 0.2206 0.2177 0.2148 -0.6 0.2743 0.2709 0.2676 0.2643 0.2611 0.2578 0.2546 0.2514 0.2483 0.2451 -0.5 0.3085 0.3050 0.3015 0.2981 0.2946 0.2912 0.2877 0.2843 0.2810 0.2776 -0.4 0.3446 0.3409 0.3372 0.3336 0.3300 0.3264 0.3228 0.3192 0.3156 0.3121 -0.3 0.3821 0.3783 0.3745 0.3707 0.3669 0.3632 0.3594 0.3557 0.3520 0.3483 -0.2 0.4207 0.4168 0.4129 0.4090 0.4052 0.4013 0.3974 0.3936 0.3897 0.3859 -0.1 0.4602 0.4562 0.4522 0.4483 0.4443 0.4404 0.4364 0.4325 0.4286 0.4247 -0.0 0.5000 0.4960 0.4920 0.4880 0.4840 0.4801 0.4761 0.4721 0.4681 0.4641
- 2. z .00 .01 .02 .03 .04 .05 .06 .07 .08 .09 0.0 0.5000 0.5040 0.5080 0.5120 0.5160 0.5199 0.5239 0.5279 0.5319 0.5359 0.1 0.5398 0.5438 0.5478 0.5517 0.5557 0.5596 0.5636 0.5675 0.5714 0.5753 0.2 0.5793 0.5832 0.5871 0.5910 0.5948 0.5987 0.6026 0.6064 0.6103 0.6141 0.3 0.6179 0.6217 0.6255 0.6293 0.6331 0.6368 0.6406 0.6443 0.6480 0.6517 0.4 0.6554 0.6591 0.6628 0.6664 0.6700 0.6736 0.6772 0.6808 0.6844 0.6879 0.5 0.6915 0.6950 0.6985 0.7019 0.7054 0.7088 0.7123 0.7157 0.7190 0.7224 0.6 0.7257 0.7291 0.7324 0.7357 0.7389 0.7422 0.7454 0.7486 0.7517 0.7549 0.7 0.7580 0.7611 0.7642 0.7673 0.7703 0.7734 0.7764 0.7794 0.7823 0.7852 0.8 0.7881 0.7910 0.7939 0.7967 0.7995 0.8023 0.8051 0.8078 0.8106 0.8133 0.9 0.8159 0.8186 0.8212 0.8238 0.8264 0.8289 0.8315 0.8340 0.8365 0.8389 1.0 0.8413 0.8438 0.8461 0.8485 0.8508 0.8531 0.8554 0.8577 0.8599 0.8621 1.1 0.8643 0.8665 0.8686 0.8708 0.8729 0.8749 0.8770 0.8790 0.8810 0.8830 1.2 0.8849 0.8869 0.8888 0.8907 0.8925 0.8944 0.8962 0.8980 0.8997 0.9015 1.3 0.9032 0.9049 0.9066 0.9082 0.9099 0.9115 0.9131 0.9147 0.9162 0.9177 1.4 0.9192 0.9207 0.9222 0.9236 0.9251 0.9265 0.9279 0.9292 0.9306 0.9319 1.5 0.9332 0.9345 0.9357 0.9370 0.9382 0.9394 0.9406 0.9418 0.9429 0.9441 1.6 0.9452 0.9463 0.9474 0.9484 0.9495 0.9505 0.9515 0.9525 0.9535 0.9545 1.7 0.9554 0.9564 0.9573 0.9582 0.9591 0.9599 0.9608 0.9616 0.9625 0.9633 1.8 0.9641 0.9649 0.9656 0.9664 0.9671 0.9678 0.9686 0.9693 0.9699 0.9706 1.9 0.9713 0.9719 0.9726 0.9732 0.9738 0.9744 0.9750 0.9756 0.9761 0.9767 2.0 0.9772 0.9778 0.9783 0.9788 0.9793 0.9798 0.9803 0.9808 0.9812 0.9817 2.1 0.9821 0.9826 0.9830 0.9834 0.9838 0.9842 0.9846 0.9850 0.9854 0.9857 2.2 0.9861 0.9864 0.9868 0.9871 0.9875 0.9878 0.9881 0.9884 0.9887 0.9890 2.3 0.9893 0.9896 0.9898 0.9901 0.9904 0.9906 0.9909 0.9911 0.9913 0.9916 2.4 0.9918 0.9920 0.9922 0.9925 0.9927 0.9929 0.9931 0.9932 0.9934 0.9936 2.5 0.9938 0.9940 0.9941 0.9943 0.9945 0.9946 0.9948 0.9949 0.9951 0.9952 2.6 0.9953 0.9955 0.9956 0.9957 0.9959 0.9960 0.9961 0.9962 0.9963 0.9964 2.7 0.9965 0.9966 0.9967 0.9968 0.9969 0.9970 0.9971 0.9972 0.9973 0.9974 2.8 0.9974 0.9975 0.9976 0.9977 0.9977 0.9978 0.9979 0.9979 0.9980 0.9981 2.9 0.9981 0.9982 0.9982 0.9983 0.9984 0.9984 0.9985 0.9985 0.9986 0.9986 3.0 0.9987 0.9987 0.9987 0.9988 0.9988 0.9989 0.9989 0.9989 0.9990 0.9990 3.1 0.9990 0.9991 0.9991 0.9991 0.9992 0.9992 0.9992 0.9992 0.9993 0.9993 3.2 0.9993 0.9993 0.9994 0.9994 0.9994 0.9994 0.9994 0.9995 0.9995 0.9995 3.3 0.9995 0.9995 0.9995 0.9996 0.9996 0.9996 0.9996 0.9996 0.9996 0.9997 3.4 0.9997 0.9997 0.9997 0.9997 0.9997 0.9997 0.9997 0.9997 0.9997 0.9998 3.5 0.9998 0.9998 0.9998 0.9998 0.9998 0.9998 0.9998 0.9998 0.9998 0.9998
- 3. valores de cuantiles de la distribuci├│n t de Student [ ] ╬▒1dt 1)/2(Žģ )/Žģ2(t1 /2)T( 1)/2(T ),1tP(T Žģ╬▒,1t ŽģŽĆŽģ Žģ Žģ╬▒ ŌłÆ=ŌłÆŌł× +ŌłÆ ’Ż║’Ż╗ ’Ż╣ ’Ż»’Ż░ ’Ż« + + =ŌłÆ< Ōł½ ŌłÆ Žģ t0.800 t0.900 t0.950 t0.975 t0.990 t0.995 t0.999 1 1.376 3.078 6.314 12.706 31.820 63.656 318.294 2 1.061 1.886 2.920 4.303 6.965 9.925 22.327 3 0.978 1.638 2.353 3.182 4.541 5.841 10.214 4 0.941 1.533 2.132 2.776 3.747 4.604 7.173 5 0.920 1.476 2.015 2.571 3.365 4.032 5.893 6 0.906 1.440 1.943 2.447 3.143 3.707 5.208 7 0.896 1.415 1.895 2.365 2.998 3.499 4.785 8 0.889 1.397 1.860 2.306 2.896 3.355 4.501 9 0.883 1.383 1.833 2.262 2.821 3.250 4.297 10 0.879 1.372 1.812 2.228 2.764 3.169 4.144 11 0.876 1.363 1.796 2.201 2.718 3.106 4.025 12 0.873 1.356 1.782 2.179 2.681 3.055 3.930 13 0.870 1.350 1.771 2.160 2.650 3.012 3.852 14 0.868 1.345 1.761 2.145 2.624 2.977 3.787 15 0.866 1.341 1.753 2.131 2.602 2.947 3.733 16 0.865 1.337 1.746 2.120 2.583 2.921 3.686 17 0.863 1.333 1.740 2.110 2.567 2.898 3.646 18 0.862 1.330 1.734 2.101 2.552 2.878 3.610 19 0.861 1.328 1.729 2.093 2.539 2.861 3.579 20 0.860 1.325 1.725 2.086 2.528 2.845 3.552 21 0.859 1.323 1.721 2.080 2.518 2.831 3.527 22 0.858 1.321 1.717 2.074 2.508 2.819 3.505 23 0.858 1.319 1.714 2.069 2.500 2.807 3.485 24 0.857 1.318 1.711 2.064 2.492 2.797 3.467 25 0.856 1.316 1.708 2.060 2.485 2.787 3.450 26 0.856 1.315 1.706 2.056 2.479 2.779 3.435 27 0.855 1.314 1.703 2.052 2.473 2.771 3.421 28 0.855 1.313 1.701 2.048 2.467 2.763 3.408 29 0.854 1.311 1.699 2.045 2.462 2.756 3.396 30 0.854 1.310 1.697 2.042 2.457 2.750 3.385 35 0.852 1.306 1.690 2.030 2.438 2.724 3.340 40 0.851 1.303 1.684 2.021 2.423 2.704 3.307 45 0.850 1.301 1.679 2.014 2.412 2.690 3.281 50 0.849 1.299 1.676 2.009 2.403 2.678 3.261 60 0.848 1.296 1.671 2.000 2.390 2.660 3.232 70 0.847 1.294 1.667 1.994 2.381 2.648 3.211 80 0.846 1.292 1.664 1.990 2.374 2.639 3.195 90 0.846 1.291 1.662 1.987 2.368 2.632 3.183 100 0.845 1.290 1.660 1.984 2.364 2.626 3.174 200 0.843 1.286 1.652 1.972 2.345 2.601 3.131 500 0.842 1.283 1.648 1.965 2.334 2.586 3.107 1000 0.842 1.282 1.646 1.962 2.330 2.581 3.098
- 4. Valores de cuantiles de la distribuci├│n chi-cuadrada ╬▒1dt0 )t/2exp(12/Žģt Žģ/2/2)2( 1 ); 1 F(X),1tP(X Žģ╬▒,1X Žģ Žģ╬▒Žģ╬▒ ŌłÆ=ŌłÆŌłÆ=ŌłÆ=ŌłÆ< Ōł½ ŌłÆ Žä Žģ X0.005 X0.010 X0.025 X0.050 X0.100 X0.900 X0.950 X0.975 X0.990 X0.995 1 0.00 0.00 0.00 0.00 0.02 2.71 3.84 5.02 6.64 7.90 2 0.01 0.02 0.05 0.10 0.21 4.60 5.99 7.38 9.22 10.59 3 0.07 0.11 0.22 0.35 0.58 6.25 7.82 9.36 11.32 12.82 4 0.21 0.30 0.48 0.71 1.06 7.78 9.49 11.15 13.28 14.82 5 0.41 0.55 0.83 1.15 1.61 9.24 11.07 12.84 15.09 16.76 6 0.67 0.87 1.24 1.63 2.20 10.65 12.60 14.46 16.81 18.55 7 0.99 1.24 1.69 2.17 2.83 12.02 14.07 16.02 18.47 20.27 8 1.34 1.64 2.18 2.73 3.49 13.36 15.51 17.55 20.08 21.94 9 1.73 2.09 2.70 3.32 4.17 14.69 16.93 19.03 21.65 23.56 10 2.15 2.55 3.24 3.94 4.86 15.99 18.31 20.50 23.19 25.15 11 2.60 3.05 3.81 4.57 5.58 17.28 19.68 21.93 24.75 26.71 12 3.06 3.57 4.40 5.22 6.30 18.55 21.03 23.35 26.25 28.25 13 3.56 4.10 5.01 5.89 7.04 19.81 22.37 24.75 27.72 29.88 14 4.07 4.65 5.62 6.57 7.79 21.07 23.69 26.13 29.17 31.38 15 4.59 5.23 6.26 7.26 8.55 22.31 25.00 27.50 30.61 32.86 16 5.14 5.81 6.90 7.96 9.31 23.55 26.30 28.86 32.03 34.32 17 5.69 6.40 7.56 8.67 10.08 24.77 27.59 30.20 33.43 35.77 18 6.25 7.00 8.23 9.39 10.86 25.99 28.88 31.54 34.83 37.21 19 6.82 7.63 8.90 10.11 11.65 27.21 30.15 32.87 36.22 38.63 20 7.42 8.25 9.59 10.85 12.44 28.42 31.42 34.18 37.59 40.05 21 8.02 8.89 10.28 11.59 13.24 29.62 32.68 35.49 38.96 41.45 22 8.62 9.53 10.98 12.34 14.04 30.82 33.93 36.79 40.31 42.84 23 9.25 10.19 11.69 13.09 14.85 32.01 35.18 38.09 41.66 44.23 24 9.87 10.85 12.40 13.84 15.66 33.20 36.42 39.38 43.00 45.60 25 10.50 11.51 13.11 14.61 16.47 34.38 37.66 40.66 44.34 46.97 26 11.13 12.19 13.84 15.38 17.29 35.57 38.89 41.94 45.66 48.33 27 11.79 12.87 14.57 16.15 18.11 36.74 40.12 43.21 46.99 49.69 28 12.44 13.55 15.30 16.92 18.94 37.92 41.34 44.47 48.30 51.04 29 13.09 14.24 16.04 17.70 19.77 39.09 42.56 45.74 49.61 52.38 30 13.77 14.94 16.78 18.49 20.60 40.26 43.78 46.99 50.91 53.71 35 17.16 18.49 20.56 22.46 24.79 46.06 49.81 53.22 57.36 60.31 40 20.67 22.14 24.42 26.51 29.06 51.80 55.75 59.34 63.71 66.80 45 24.28 25.88 28.36 30.61 33.36 57.50 61.65 65.41 69.98 73.20 50 27.96 29.68 32.35 34.76 37.69 63.16 67.50 71.42 76.17 79.52 60 35.50 37.46 40.47 43.19 46.46 74.39 79.08 83.30 88.40 91.98 70 43.25 45.42 48.75 51.74 55.33 85.52 90.53 95.03 100.44 104.24 80 51.14 53.52 57.15 60.39 64.28 96.57 101.88 106.63 112.34 116.35 90 59.17 61.74 65.64 69.13 73.29 107.56 113.14 118.14 124.13 128.32 100 67.30 70.05 74.22 77.93 82.36 118.49 124.34 129.56 135.82 140.19