Test
?Download as PPTX, PDF?
0 likes?185 views

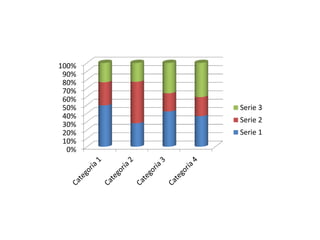
This chart shows the progress of three different series over time, with percentages ranging from 0-100% on the y-axis. Serie 1 starts at 0% and rises steadily to 100% by the end. Serie 2 follows a similar pattern but levels off around 80%. Serie 3 fluctuates more but ultimately reaches 100% like the first series.