Thoughts on Systematic Risk in Financial Systems
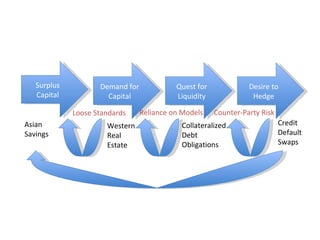
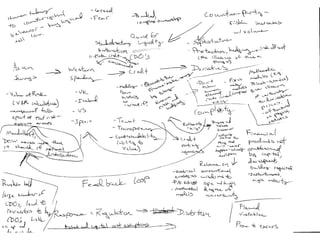
- 1. Surplus Capital Demand for Capital Quest for Liquidity Desire to Hedge Asian Savings Western Real Estate Collateralized Debt Obligations Credit Default Swaps Counter-Party Risk Loose Standards Reliance on Models
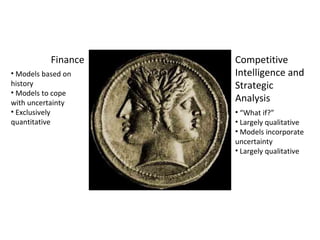
- 2. Finance Competitive Intelligence and Strategic Analysis Models based on history Models to cope with uncertainty Exclusively quantitative “What if?” Largely qualitative Models incorporate uncertainty Largely qualitative
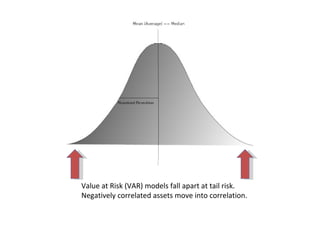
- 3. Value at Risk (VAR) models fall apart at tail risk. Negatively correlated assets move into correlation.
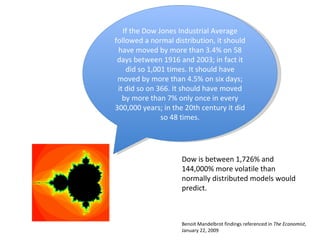
- 4. If the Dow Jones Industrial Average followed a normal distribution, it should have moved by more than 3.4% on 58 days between 1916 and 2003; in fact it did so 1,001 times. It should have moved by more than 4.5% on six days; it did so on 366. It should have moved by more than 7% only once in every 300,000 years; in the 20th century it did so 48 times. Benoit Mandelbrot findings referenced in The Economist , January 22, 2009 Dow is between 1,726% and 144,000% more volatile than normally distributed models would predict.
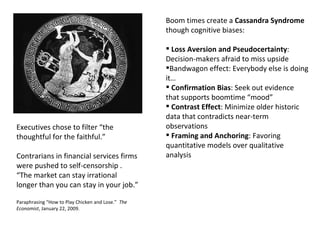
- 5. Boom times create a Cassandra Syndrome though cognitive biases: Loss Aversion and Pseudocertainty : Decision-makers afraid to miss upside Bandwagon effect: Everybody else is doing it… Confirmation Bias : Seek out evidence that supports boomtime “mood” Contrast Effect : Minimize older historic data that contradicts near-term observations Framing and Anchoring : Favoring quantitative models over qualitative analysis Executives chose to filter “the thoughtful for the faithful.” Contrarians in financial services firms were pushed to self-censorship . “The market can stay irrational longer than you can stay in your job.” Paraphrasing “How to Play Chicken and Lose.” The Economist , January 22, 2009.
- 6. Ěý
- 7. Ěý

