Time series report
ŌĆó
0 likesŌĆó569 views

This document analyzes COVID-19 case and death data from April and May 2020 in 6 countries. It presents plots of new cases and deaths over time. It discusses differences between countries in total population, measures taken, testing levels, culture and HDI that influence case and death rates. It also examines differences over time, finding the US peak was much higher than UK and France in late March and lockdowns reduced cyclicality of French data versus UK data. The document concludes there are numerous differences between countries and over time and puts forth some hypotheses for these differences.


Time series report
- 1. COVID Analysis Maria Roulet Sterkel, Elie Brosset, Sirine Haddouche Cases and deaths April and May 2020
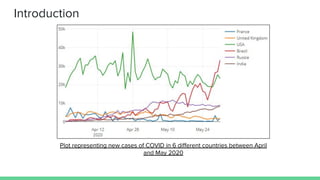
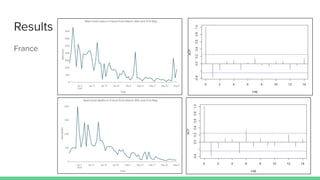
- 2. Introduction Plot representing new cases of COVID in 6 di’¼Ćerent countries between April and May 2020
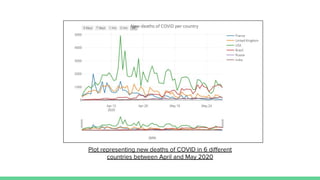
- 3. Plot representing new deaths of COVID in 6 di’¼Ćerent countries between April and May 2020
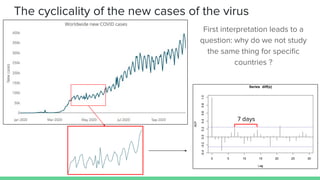
- 5. The cyclicality of the new cases of the virus First interpretation leads to a question: why do we not study the same thing for speci’¼üc countries ? 7 days
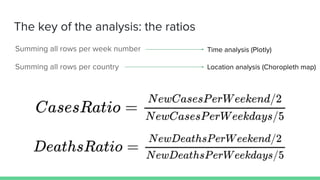
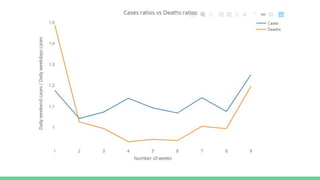
- 6. The key of the analysis: the ratios Summing all rows per week number Summing all rows per country Time analysis (Plotly) Location analysis (Choropleth map)
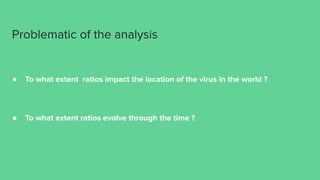
- 7. Problematic of the analysis ŌŚÅ To what extent ratios impact the location of the virus in the world ? ŌŚÅ To what extent ratios evolve through the time ?
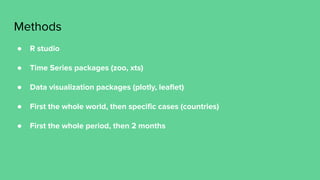
- 8. Methods ŌŚÅ R studio ŌŚÅ Time Series packages (zoo, xts) ŌŚÅ Data visualization packages (plotly, lea’¼éet) ŌŚÅ First the whole world, then speci’¼üc cases (countries) ŌŚÅ First the whole period, then 2 months
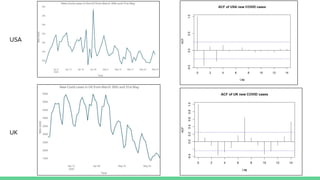
- 10. USA UK
- 13. Discussion Di’¼Ćerence between countries and over time
- 14. Di’¼Ćerence between countries ŌŚÅ Such di’¼Ćerences are due to certain unique parameters such as - Total population - Measures taken - Amount of tests done - Culture - HDI
- 15. Di’¼Ćerence over time ŌŚÅ Geographical impact: - USA 8x more cases than UK and France (late March) - USA more marked peak (48925 cases on April 26th) ŌŚÅ Impact on cyclicality: - The di’¼Ćerence between weekdays and weekend depends on the period we looked at. For example, in April and May 2020 in France, the lockdown made the data less seasonal than the one for UK for example.
- 16. Conclusion ŌŚÅ Numerous di’¼Ćerences: - between countries - over time ŌŚÅ Hypothesis