Time series representations for better data mining
- 1. Time Series Representations for Better Data Mining What can we do with time series data? ŌĆó Classification ŌĆó Clustering ŌĆó Anomaly (outlier) detection ŌĆó Forecasting What are the problems with time series data? ŌĆó High-dimension ŌĆó Noise ŌĆó Concept-drift (trend-shift etc.) 1
- 2. Time Series Representations What can we do for solving these problems? ŌĆó Use time series representations! They are excellent to: ŌĆó Reduce memory load. ŌĆó Accelerate subsequent machine learning algorithms. ŌĆó Implicitly remove noise from the data. ŌĆó Emphasize the essential characteristics of the data. ŌĆó Help to find patterns in data (or motifs). 2
- 3. 4.00 4.25 4.50 4.75 0 500 1000 Time Load 4.0 4.2 4.4 4.6 4.8 0 50 100 150 Length Load 4.0 4.2 4.4 4.6 4.8 0 50 100 150 Length Load 3
- 4. 4.00 4.25 4.50 4.75 0 500 1000 Time Load 4.2 4.3 4.4 4.5 4.6 0 10 20 30 40 50 Length Load 4.2 4.4 4.6 0 100 200 300 Length Load 4
- 5. TSrepr TSrepr - CRAN1, GitHub2 ŌĆó R package for time series representations computing ŌĆó Large amount of various methods are implemented ŌĆó Several useful support functions are also included ŌĆó Easy to extend and to use data <- rnorm(1000) repr_paa(data, func = median, q = 10) 1 https://CRAN.R-project.org/package=TSrepr 2 https://github.com/PetoLau/TSrepr/ 5
- 6. All type of time series representations methods are implemented, so far these: ŌĆó PAA - Piecewise Aggregate Approximation ( repr_paa ) ŌĆó DWT - Discrete Wavelet Transform ( repr_dwt ) ŌĆó DFT - Discrete Fourier Transform ( repr_dft ) ŌĆó DCT - Discrete Cosine Transform ( repr_dct ) ŌĆó PIP - Perceptually Important Points ( repr_pip ) ŌĆó SAX - Symbolic Aggregate Approximation ( repr_sax ) ŌĆó PLA - Piecewise Linear Approximation ( repr_pla ) ŌĆó Mean seasonal profile ( repr_seas_profile ) ŌĆó Model-based seasonal representations based on linear model ( repr_lm ) ŌĆó FeaClip - Feature extraction from clipping representation ( repr_feaclip ) Additional useful functions are implemented as: ŌĆó Windowing ( repr_windowing ) ŌĆó Matrix of representations ( repr_matrix ) ŌĆó Normalisation functions - z-score ( norm_z ), min-max ( norm_min_max ) 6
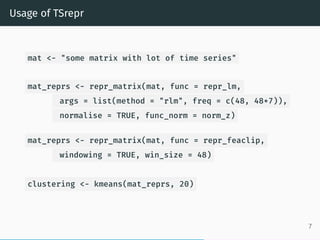
- 7. Usage of TSrepr mat <- "some matrix with lot of time series" mat_reprs <- repr_matrix(mat, func = repr_lm, args = list(method = "rlm", freq = c(48, 48*7)), normalise = TRUE, func_norm = norm_z) mat_reprs <- repr_matrix(mat, func = repr_feaclip, windowing = TRUE, win_size = 48) clustering <- kmeans(mat_reprs, 20) 7
- 8. 17 18 19 20 13 14 15 16 9 10 11 12 5 6 7 8 1 2 3 4 0 20 40 0 20 40 0 20 40 0 20 40 ŌłÆ1 0 1 2 3 ŌłÆ2 ŌłÆ1 0 1 2 3 ŌłÆ2 0 2 ŌłÆ2 0 2 ŌłÆ2 ŌłÆ1 0 1 2 3 ŌłÆ1 0 1 2 ŌłÆ3 ŌłÆ2 ŌłÆ1 0 1 2 ŌłÆ2 0 2 ŌłÆ2 ŌłÆ1 0 1 2 0 2 4 ŌłÆ2 0 2 4 ŌłÆ1 0 1 2 ŌłÆ2 0 2 4 ŌłÆ2 0 2 ŌłÆ2 ŌłÆ1 0 1 2 3 ŌłÆ1 0 1 2 ŌłÆ1 0 1 2 3 0 2 4 ŌłÆ2 ŌłÆ1 0 1 2 ŌłÆ2 ŌłÆ1 0 1 2 Length RegressionCoefficients
- 9. 17 18 19 20 13 14 15 16 9 10 11 12 5 6 7 8 1 2 3 4 0 250 500 750 1000 0 250 500 750 1000 0 250 500 750 1000 0 250 500 750 1000 ŌłÆ0.5 0.0 0.5 1.0 1.5 ŌłÆ1.5 ŌłÆ1.0 ŌłÆ0.5 0.0 0.5 1.0 ŌłÆ0.50 ŌłÆ0.25 0.00 0.25 ŌłÆ1 0 1 ŌłÆ1.0 ŌłÆ0.5 0.0 0.5 ŌłÆ1.0 ŌłÆ0.5 0.0 0.5 1.0 ŌłÆ1.0 ŌłÆ0.5 0.0 0.5 ŌłÆ1.0 ŌłÆ0.5 0.0 0.5 1.0 ŌłÆ1.0 ŌłÆ0.5 0.0 0.5 1.0 ŌłÆ0.5 0.0 0.5 1.0 0 1 0 1 2 ŌłÆ0.5 0.0 0.5 ŌłÆ1.0 ŌłÆ0.5 0.0 0.5 1.0 ŌłÆ0.5 0.0 0.5 1.0 1.5 0 1 0 1 2 0 1 2 3 4 5 ŌłÆ1.0 ŌłÆ0.5 0.0 0.5 1.0 ŌłÆ1 0 1 Time NormalizedLoad
- 10. Simple extensibility of TSrepr Example #1: library(moments) data_ts_skew <- repr_paa(data, q = 48, func = skewness) Example #2: repr_fea_extract <- function(x) c(mean(x), median(x), max(x), min(x), sd(x)) data_fea <- repr_windowing(data, win_size = 100, func = repr_fea_extract) 10
- 11. Conclusions Time Series Representations: ŌĆó They are our fiends in clustering, forecasting, classification etc. ŌĆó Implemented in TSrepr Questions: Peter Laurinec tsreprpackage@gmail.com Code: https://github.com/PetoLau/TSrepr/ More research: https://petolau.github.io/research Blog: https://petolau.github.io And of course: install.packages("TSrepr") 11


