Transito de venus 2012
0 likes162 views

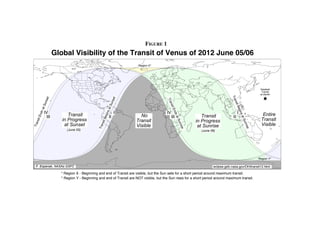
The document is a figure showing the global visibility of the transit of Venus on June 5-6, 2012. It depicts the Earth divided into five regions based on visibility. Region X could see the beginning and end of the transit but the Sun set during maximum transit. Region Y could not see the beginning or end but the Sun rose during maximum transit. The other regions could see varying portions of the transit depending on their location.
Transito de venus 2012
- 1. FIGURE 1 Global Visibility of the Transit of Venus of 2012 June 05/06 Region X* Greatest Transit at Zenith Tra t t nse nse Tra nsi t Su t Su nsi t Be t En sa sa gin IV I IV I ds gin End Transit Entire sa III II No III Transit II t Be at S t Su in Progress Transit nsit Transit in Progress nsi unr Visible nris Tra at Sunset Visible at Sunrise Tra ise e (June 05) (June 06) Region Y* F. Espenak, NASAs GSFC eclipse.gsfc.nasa.gov/OH/transit12.html * Region X - Beginning and end of Transit are visible, but the Sun sets for a short period around maximum transit. * Region Y - Beginning and end of Transit are NOT visible, but the Sun rises for a short period around maximum transit.