Treb housing market_charts-april_2011
0 likes228 views

The document contains charts analyzing the Toronto housing market in April 2011. It shows trends in MLS sales, new listings, average prices, and the sales to new listings ratio over the past 3-4 years. The ratios and trends indicate that in 2011 prices were increasing faster than inflation compared to previous years. Affordability was also declining, with households needing to spend a larger share of income on housing costs.
Treb housing market_charts-april_2011
- 1. Housing Market Charts – April 2011
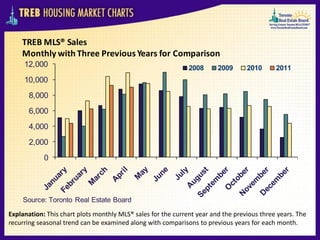
- 2. TREB MLS® Sales Monthly with Three Previous Years for Comparison 12,000 2008 2009 2010 2011 10,000 8,000 6,000 4,000 2,000 0 Source: Toronto Real Estate Board Explanation: This chart plots monthly MLS® sales for the current year and the previous three years. The recurring seasonal trend can be examined along with comparisons to previous years for each month.
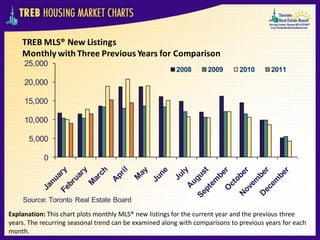
- 3. TREB MLS® New Listings Monthly with Three Previous Years for Comparison 25,000 2008 2009 2010 2011 20,000 15,000 10,000 5,000 0 Source: Toronto Real Estate Board Explanation: This chart plots monthly MLS® new listings for the current year and the previous three years. The recurring seasonal trend can be examined along with comparisons to previous years for each month.
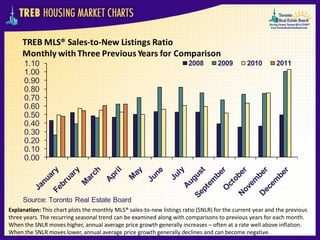
- 4. TREB MLS® Sales-to-New Listings Ratio Monthly with Three Previous Years for Comparison 1.10 2008 2009 2010 2011 1.00 0.90 0.80 0.70 0.60 0.50 0.40 0.30 0.20 0.10 0.00 Source: Toronto Real Estate Board Explanation: This chart plots the monthly MLS® sales-to-new listings ratio (SNLR) for the current year and the previous three years. The recurring seasonal trend can be examined along with comparisons to previous years for each month. When the SNLR moves higher, annual average price growth generally increases – often at a rate well above inflation. When the SNLR moves lower, annual average price growth generally declines and can become negative.
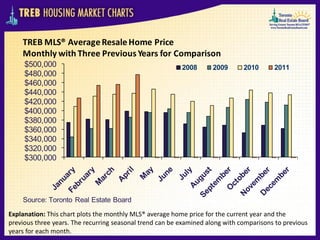
- 5. TREB MLS® Average Resale Home Price Monthly with Three Previous Years for Comparison $500,000 2008 2009 2010 2011 $480,000 $460,000 $440,000 $420,000 $400,000 $380,000 $360,000 $340,000 $320,000 $300,000 Source: Toronto Real Estate Board Explanation: This chart plots the monthly MLS® average home price for the current year and the previous three years. The recurring seasonal trend can be examined along with comparisons to previous years for each month.
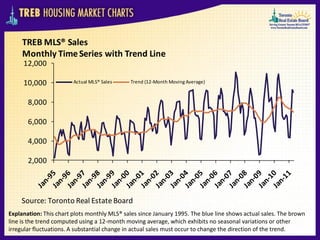
- 6. TREB MLS® Sales Monthly Time Series with Trend Line 12,000 10,000 Actual MLS® Sales Trend (12-Month Moving Average) 8,000 6,000 4,000 2,000 Source: Toronto Real Estate Board Explanation: This chart plots monthly MLS® sales since January 1995. The blue line shows actual sales. The brown line is the trend computed using a 12-month moving average, which exhibits no seasonal variations or other irregular fluctuations. A substantial change in actual sales must occur to change the direction of the trend.
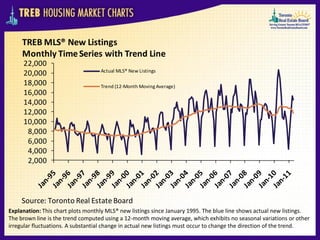
- 7. TREB MLS® New Listings Monthly Time Series with Trend Line 22,000 Actual MLS® New Listings 20,000 18,000 Trend (12-Month Moving Average) 16,000 14,000 12,000 10,000 8,000 6,000 4,000 2,000 Source: Toronto Real Estate Board Explanation: This chart plots monthly MLS® new listings since January 1995. The blue line shows actual new listings. The brown line is the trend computed using a 12-month moving average, which exhibits no seasonal variations or other irregular fluctuations. A substantial change in actual new listings must occur to change the direction of the trend.
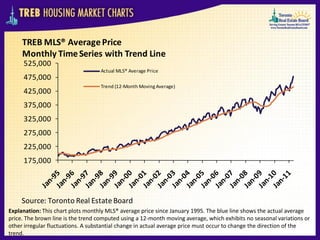
- 8. TREB MLS® Average Price Monthly Time Series with Trend Line 525,000 Actual MLS® Average Price 475,000 Trend (12-Month Moving Average) 425,000 375,000 325,000 275,000 225,000 175,000 Source: Toronto Real Estate Board Explanation: This chart plots monthly MLS® average price since January 1995. The blue line shows the actual average price. The brown line is the trend computed using a 12-month moving average, which exhibits no seasonal variations or other irregular fluctuations. A substantial change in actual average price must occur to change the direction of the trend.
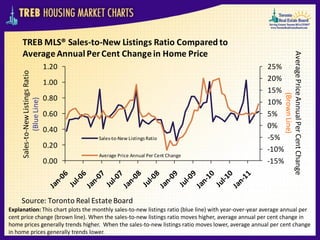
- 9. TREB MLS® Sales-to-New Listings Ratio Compared to Average Annual Per Cent Change in Home Price Average Price Annual Per Cent Change 1.20 25% Sales-to-New Listings Ratio 1.00 20% 15% (Brown Line) 0.80 (Blue Line) 10% 0.60 5% 0.40 0% Sales-to-New Listings Ratio -5% 0.20 -10% Average Price Annual Per Cent Change 0.00 -15% Source: Toronto Real Estate Board Explanation: This chart plots the monthly sales-to-new listings ratio (blue line) with year-over-year average annual per cent price change (brown line). When the sales-to-new listings ratio moves higher, average annual per cent change in home prices generally trends higher. When the sales-to-new listings ratio moves lower, average annual per cent change in home prices generally trends lower.
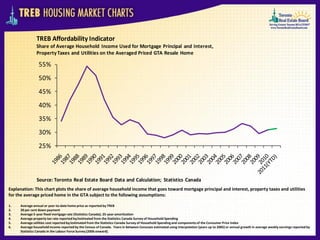
- 10. TREB Affordability Indicator Share of Average Household Income Used for Mortgage Principal and Interest, Property Taxes and Utilities on the Averaged Priced GTA Resale Home 55% 50% 45% 40% 35% 30% 25% Source: Toronto Real Estate Board Data and Calculation; Statistics Canada Explanation: This chart plots the share of average household income that goes toward mortgage principal and interest, property taxes and utilities for the average priced home in the GTA subject to the following assumptions: 1. Average annual or year-to-date home price as reported by TREB 2. 20 per cent down payment 3. Average 5-year fixed mortgage rate (Statistics Canada); 25-year amortization 4. Average property tax rate reported by/estimated from the Statistics Canada Survey of Household Spending 5. Average utilities cost reported by/estimated from the Statistics Canada Survey of Household Spending and components of the Consumer Price Index 6. Average household income reported by the Census of Canada. Years in between Censuses estimated using interpolation (years up to 2005) or annual growth in average weekly earnings reported by Statistics Canada in the Labour Force Survey (2006 onward).