Trends of Families
- 1. Trends of Families FAM 251 Intro to Family Studies
- 2. Change in Family Emphasis From instrumental to expressive
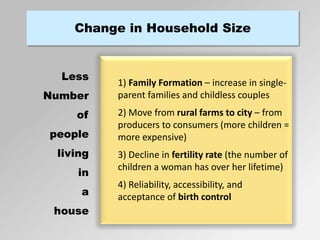
- 3. Change in Household Size True 1) Family Formation ¨C increase in single- parent families and childless couples 2) Move from rural farms to city ¨C from producers to consumers (more children = more expensive) 3) Decline in fertility rate (the number of children a woman has over her lifetime) 4) Reliability, accessibility, and acceptance of birth control Less Number of people living in a house
- 4. Change in Age of First Marriage 1955 Males 22.5 yrs Females 20.1 yrs 2010 Males 28.2 yrs Females 26.1 yrs
- 5. In the past 30 years, the percent of women age 20-24 who had never married jumped from: 36% to 79% (2010) In the past 30 years, the % of men ages 30-34 who had never married increased from: 6% to 36% (2010) Change in Age of First Marriage
- 6. Why are people waiting longer to get married? ? Longer time in school ? Less negativity with being single ? Longer life expectancy ? WomenˇŻs career options ? Acceptance of nonmarital sexual intercourse ? Acceptance of nonmarital cohabitation
- 7. MothersˇŻ Employment Outside Home In 2008, 77% of married women whose youngest child was between 6 and 17 were employed. In 2005, 64% of married women whose youngest child was under age 6 were employed. More women with non school-aged children are employed now outside the home than ever before? Why? Personal Fulfillment? Higher standard of living? Biggest reason: Financial need
- 8. Increase in Single Parenting 1970: 11% Percent of children age 18 and younger living with a single parent: 2009: 34% What are the most significant reasons for increase in single parent families? Divorce (over 50% of divorces involve children) Nonmarital births (40% of all births are to unwed mothers) 1970: 4% 2009: 9% Percentage of single parent households
- 9. Cohabitation Percentage of opposite-sex couples who planned to get married lived together first? 1960: 10% 2005: 60% Why are more couples choosing to cohabitate today than 35 years ago?
- 10. Grandparent-headed Households Percentage of children (0-18) living in a grandparent-headed household 1970: 3% 2010: 10% Why the increase in grandparent-headed households over the last 40 years? Number of children under age 18 were being raised by their grandparents 1970: 2.2 million 2001: 4.9 million
- 11. Life Expectancy 1900: 47 years 2010: Men 75 years Women 80 years Think about this for a minute. WeˇŻve seen a 30+ year increase in life expectancy over the last 100 years. What impact do you think this has had on family life? How has it affected timing for marriage, children, or grandparent and care for older adults?


