ºÝºÝߣ

ºÝºÝߣShare a Scribd company logo
Higher Intensification of Tropical Cyclone
in Bay Of Bengal Coast than Arabian Sea Coast:
An Analytical Assessment and Reasoning of Vulnerability
Deepalok Banerjee1
Suhel Sen2
Ex-students
1Dept. of Geography, University Of Calcutta
2Dept. of Geography, Bhairab Ganguly College
Tropical cyclone   copy
WHAT IS TROPICAL CYCLONE?
? Tropical Cyclones represent a closed low pressure
system having a diameter of 650 km with air rotating
in an anti clockwise direction in the northern
hemisphere & in a clockwise direction in the southern
hemisphere. The energy emitted by a tropical cyclone
is equivalent to the energy emitted by 10000 atomic
bombs that were hurled at Nagasaki of Japan in the 2nd
World War.
NOMENCLATURE
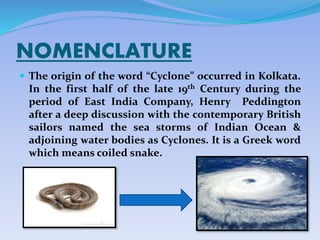
? The origin of the word ¡°Cyclone¡± occurred in Kolkata.
In the first half of the late 19th Century during the
period of East India Company, Henry Peddington
after a deep discussion with the contemporary British
sailors named the sea storms of Indian Ocean &
adjoining water bodies as Cyclones. It is a Greek word
which means coiled snake.
MAJOR FEATURES
? Prevalent between tropic of Cancer & Capricorn.
? Diameter- From 80 km to 300 km.
? Wind velocity- 32 km/hr in weak cyclones. 180 km/hr in case of
Hurricanes.
? More vigorous over sea. But becomes weak & feeble as soon as it
enters the land mass.
? Tropical cyclones are not characterized by temperature
differences. Hence, they do not have fronts.
? Not always mobile. May remain stationary at a place for days &
shed heavy rain causing floods.
? Disastrous due to storm surge, high wind speed & high rainfall
intensity.
FAVOURABLE CONDITIONS
? Continuous supply of abundant warm & moist air.
? Warm ocean surface of temperature of 27?C.
? Pre existing weak tropical disturbances.
? Existence of anticyclonic condition at a height of 9000
m to 15000 m above the surface disturbance.
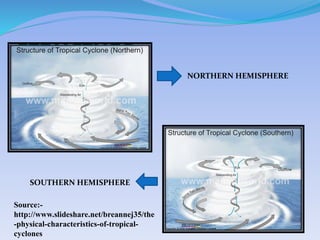
STRUCTURE
NORTHERN HEMISPHERE
SOUTHERN HEMISPHERE
Source:-
http://www.slideshare.net/breannej35/the
-physical-characteristics-of-tropical-
cyclones
SEQUENTIAL CONVERSION
? Low Pressure (L).
? Deep Depression (DD).
? Cyclonic Storm (CS).
? Severe cyclonic storm (SCS)
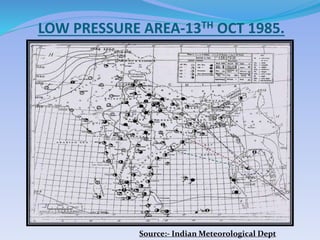
LOW PRESSURE AREA-13TH OCT 1985.
Source:- Indian Meteorological Dept
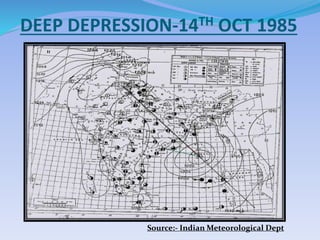
DEEP DEPRESSION-14TH OCT 1985
Source:- Indian Meteorological Dept
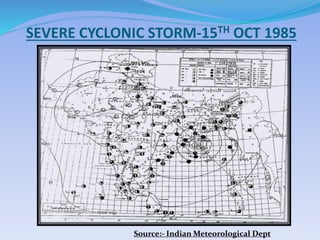
SEVERE CYCLONIC STORM-15TH OCT 1985
Source:- Indian Meteorological Dept
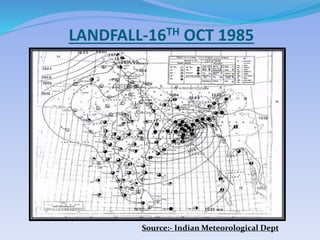
LANDFALL-16TH OCT 1985
Source:- Indian Meteorological Dept
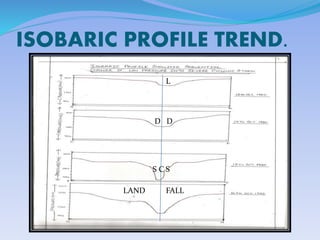
ISOBARIC PROFILE TREND.
L
D D
S C S
LAND FALL
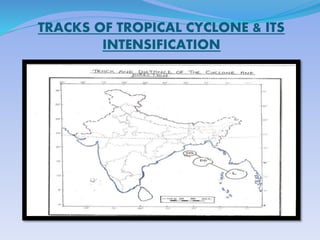
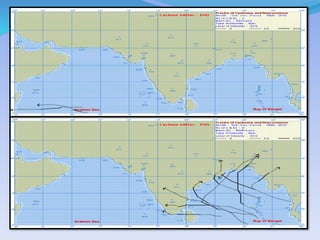
TRACKS OF TROPICAL CYCLONE & ITS
INTENSIFICATION
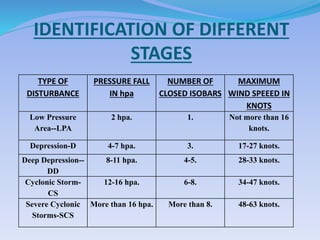
IDENTIFICATION OF DIFFERENT
STAGES
TYPE OF
DISTURBANCE
PRESSURE FALL
IN hpa
NUMBER OF
CLOSED ISOBARS
MAXIMUM
WIND SPEEED IN
KNOTS
Low Pressure
Area--LPA
2 hpa. 1. Not more than 16
knots.
Depression-D 4-7 hpa. 3. 17-27 knots.
Deep Depression--
DD
8-11 hpa. 4-5. 28-33 knots.
Cyclonic Storm-
CS
12-16 hpa. 6-8. 34-47 knots.
Severe Cyclonic
Storms-SCS
More than 16 hpa. More than 8. 48-63 knots.
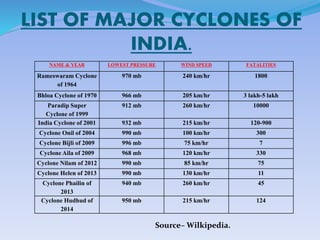
LIST OF MAJOR CYCLONES OF
INDIA.
NAME & YEAR LOWEST PRESSURE WIND SPEED FATALITIES
Rameswaram Cyclone
of 1964
970 mb 240 km/hr 1800
Bhloa Cyclone of 1970 966 mb 205 km/hr 3 lakh-5 lakh
Paradip Super
Cyclone of 1999
912 mb 260 km/hr 10000
India Cyclone of 2001 932 mb 215 km/hr 120-900
Cyclone Onil of 2004 990 mb 100 km/hr 300
Cyclone Bijli of 2009 996 mb 75 km/hr 7
Cyclone Aila of 2009 968 mb 120 km/hr 330
Cyclone Nilam of 2012 990 mb 85 km/hr 75
Cyclone Helen of 2013 990 mb 130 km/hr 11
Cyclone Phailin of
2013
940 mb 260 km/hr 45
Cyclone Hudhud of
2014
950 mb 215 km/hr 124
Source¨C Wilkipedia.
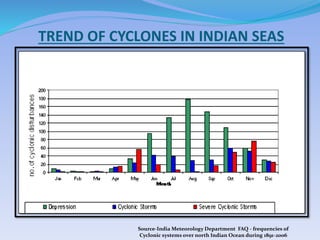
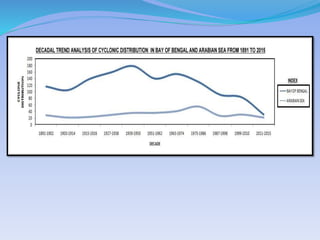
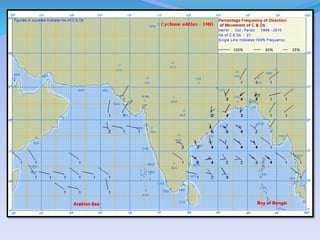
TREND OF CYCLONES IN INDIAN SEAS
Source-India Meteorology Department FAQ - frequencies of
Cyclonic systems over north Indian Ocean during 1891-2006
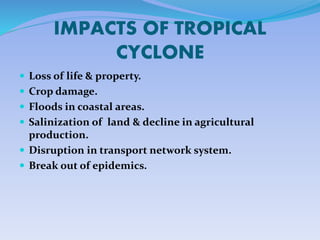
IMPACTS OF TROPICAL
CYCLONE
? Loss of life & property.
? Crop damage.
? Floods in coastal areas.
? Salinization of land & decline in agricultural
production.
? Disruption in transport network system.
? Break out of epidemics.
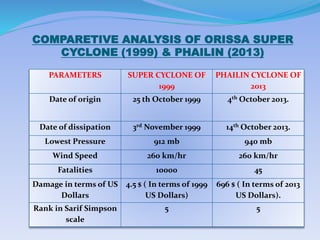
COMPARETIVE ANALYSIS OF ORISSA SUPER
CYCLONE (1999) & PHAILIN (2013)
PARAMETERS SUPER CYCLONE OF
1999
PHAILIN CYCLONE OF
2013
Date of origin 25 th October 1999 4th October 2013.
Date of dissipation 3rd November 1999 14th October 2013.
Lowest Pressure 912 mb 940 mb
Wind Speed 260 km/hr 260 km/hr
Fatalities 10000 45
Damage in terms of US
Dollars
4.5 $ ( In terms of 1999
US Dollars)
696 $ ( In terms of 2013
US Dollars).
Rank in Sarif Simpson
scale
5 5
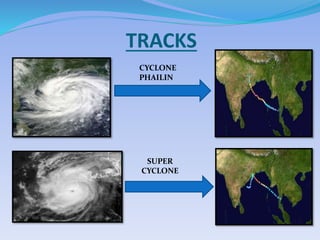
TRACKS
CYCLONE
PHAILIN
SUPER
CYCLONE
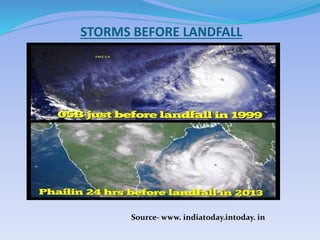
STORMS BEFORE LANDFALL
Source- www. indiatoday.intoday. in
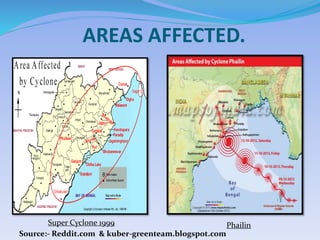
AREAS AFFECTED.
Super Cyclone 1999 Phailin
Source:- Reddit.com & kuber-greenteam.blogspot.com
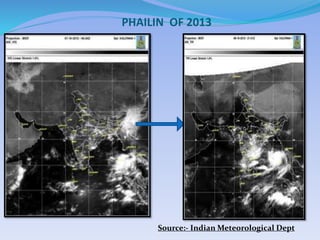
PHAILIN OF 2013
Source:- Indian Meteorological Dept
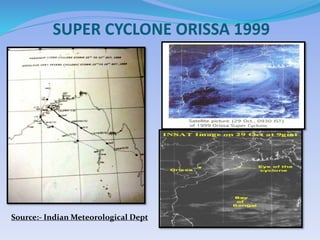
SUPER CYCLONE ORISSA 1999
Source:- Indian Meteorological Dept
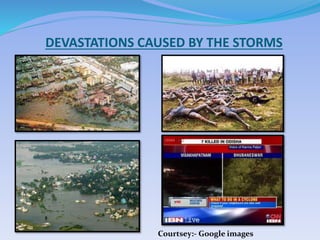
DEVASTATIONS CAUSED BY THE STORMS
Courtsey:- Google images
WHY SUPER CYCLONE OVERTOPPED
PHAILIN IN TERMS OF DEATH TOLLS?
? Super Cyclone of 1999 remained stationary over Paradip coast for
about 36 hrs causing more damage while Phailin behaved in a normal
way like other tropical cyclones. Besieds, the Orissa Government
hardly took the forecasting of the weather office seriously & took
preventive steps. Fishermen went to the sea ignoring the warnings of
the arriving hazard. However, at the time of Phailin, public awareness,
developed forecasting system, use of remote sensing & coordination of
various Government agencies acted as a key tool in reducing the death
tolls between 30 to 45. Thus, Phailin caused less death tolls than Super
Cyclone although both were ranked 5 on the Sarif Simpson scale.
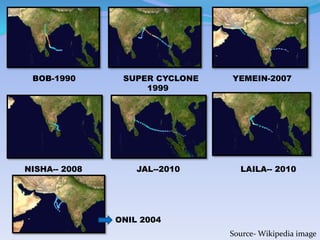
BOB-1990 YEMEIN-2007
LAILA-- 2010NISHA-- 2008 JAL--2010
SUPER CYCLONE
1999
ONIL 2004
Source- Wikipedia image
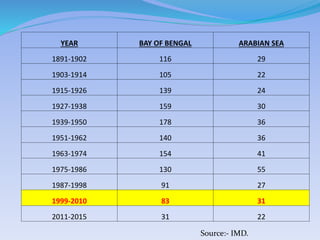
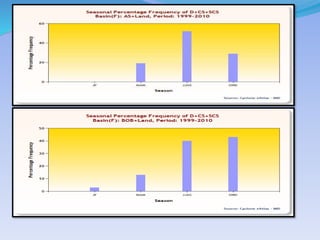
YEAR BAY OF BENGAL ARABIAN SEA
1891-1902 116 29
1903-1914 105 22
1915-1926 139 24
1927-1938 159 30
1939-1950 178 36
1951-1962 140 36
1963-1974 154 41
1975-1986 130 55
1987-1998 91 27
1999-2010 83 31
2011-2015 31 22
Source:- IMD.
Tropical cyclone   copy
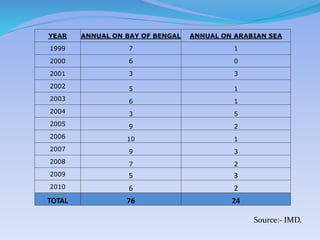
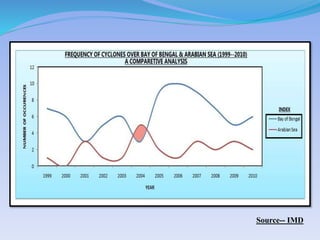
YEAR ANNUAL ON BAY OF BENGAL ANNUAL ON ARABIAN SEA
1999 7 1
2000 6 0
2001 3 3
2002 5 1
2003 6 1
2004 3 5
2005 9 2
2006 10 1
2007 9 3
2008 7 2
2009 5 3
2010 6 2
TOTAL 76 24
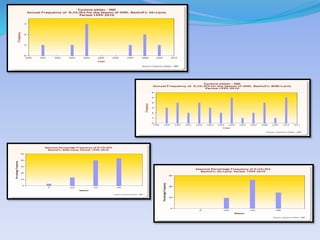
Source:- IMD.
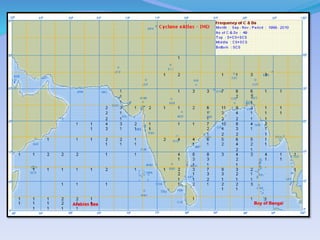
Source-- IMD
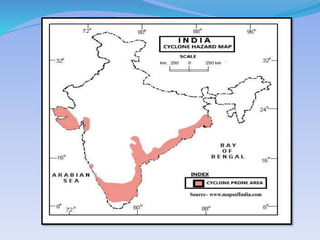
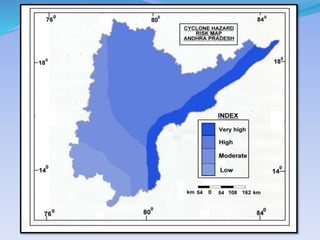
Source¨C www.mapsofIndia.com
Tropical cyclone   copy
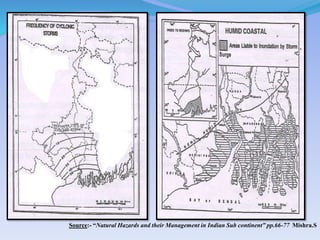
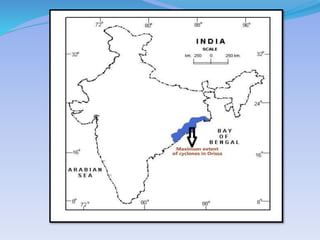
Source:- ¡°Natural Hazards and their Management in Indian Sub continent¡± pp.66-77 Mishra.S
Tropical cyclone   copy
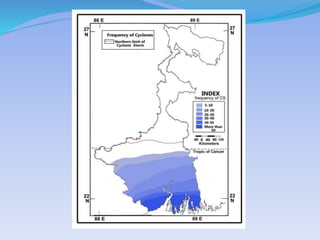
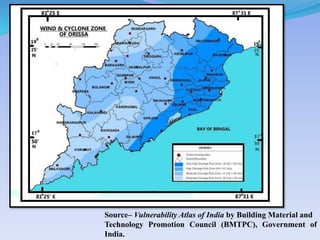
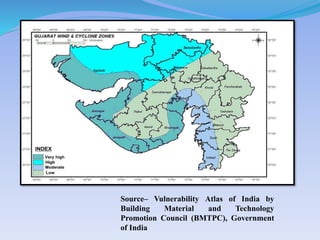
Source¨C Vulnerability Atlas of India by Building Material and
Technology Promotion Council (BMTPC), Government of
India.
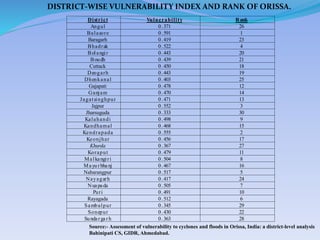
District Vulnerability Rank
Angul 0.371 26
Balasore 0.591 1
Baragarh 0.419 23
Bhadrak 0.522 4
Bolangir 0.443 20
Boudh 0.439 21
Cuttack 0.450 18
Deogarh 0.443 19
Dhenkanal 0.403 25
Gajapati 0.478 12
Ganjam 0.470 14
Jagatsinghpur 0.471 13
Jajpur 0.552 3
Jharsuguda 0.333 30
Kalahandi 0.498 9
Kandhamal 0.468 15
Kendrapada 0.555 2
Keonjhar 0.456 17
Khurda 0.367 27
Koraput 0.479 11
Malkangiri 0.504 8
Mayu rbhanj 0.467 16
Nabarangpur 0.517 5
Nayagarh 0.417 24
Nuapada 0.505 7
Puri 0.491 10
Rayagada 0.512 6
Sambalpur 0.345 29
Sonepur 0.430 22
Sundargarh 0.363 28
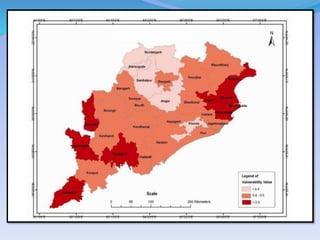
DISTRICT-WISE VULNERABILITY INDEX AND RANK OF ORISSA.
Source:- Assessment of vulnerability to cyclones and floods in Orissa, India: a district-level analysis
Bahinipati CS, GIDR, Ahmedabad.
Tropical cyclone   copy
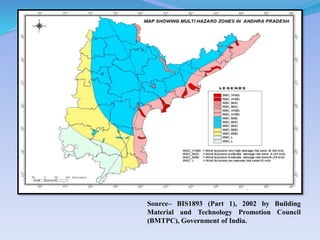
Source¨C BIS1893 (Part 1), 2002 by Building
Material and Technology Promotion Council
(BMTPC), Government of India.
Tropical cyclone   copy
Source¨C Vulnerability Atlas of India by
Building Material and Technology
Promotion Council (BMTPC), Government
of India
Tropical cyclone   copy

More Related Content

Tropical cyclone copy

  • 1. Higher Intensification of Tropical Cyclone in Bay Of Bengal Coast than Arabian Sea Coast: An Analytical Assessment and Reasoning of Vulnerability Deepalok Banerjee1 Suhel Sen2 Ex-students 1Dept. of Geography, University Of Calcutta 2Dept. of Geography, Bhairab Ganguly College
  • 3. WHAT IS TROPICAL CYCLONE? ? Tropical Cyclones represent a closed low pressure system having a diameter of 650 km with air rotating in an anti clockwise direction in the northern hemisphere & in a clockwise direction in the southern hemisphere. The energy emitted by a tropical cyclone is equivalent to the energy emitted by 10000 atomic bombs that were hurled at Nagasaki of Japan in the 2nd World War.
  • 4. NOMENCLATURE ? The origin of the word ¡°Cyclone¡± occurred in Kolkata. In the first half of the late 19th Century during the period of East India Company, Henry Peddington after a deep discussion with the contemporary British sailors named the sea storms of Indian Ocean & adjoining water bodies as Cyclones. It is a Greek word which means coiled snake.
  • 5. MAJOR FEATURES ? Prevalent between tropic of Cancer & Capricorn. ? Diameter- From 80 km to 300 km. ? Wind velocity- 32 km/hr in weak cyclones. 180 km/hr in case of Hurricanes. ? More vigorous over sea. But becomes weak & feeble as soon as it enters the land mass. ? Tropical cyclones are not characterized by temperature differences. Hence, they do not have fronts. ? Not always mobile. May remain stationary at a place for days & shed heavy rain causing floods. ? Disastrous due to storm surge, high wind speed & high rainfall intensity.
  • 6. FAVOURABLE CONDITIONS ? Continuous supply of abundant warm & moist air. ? Warm ocean surface of temperature of 27?C. ? Pre existing weak tropical disturbances. ? Existence of anticyclonic condition at a height of 9000 m to 15000 m above the surface disturbance.
  • 8. SEQUENTIAL CONVERSION ? Low Pressure (L). ? Deep Depression (DD). ? Cyclonic Storm (CS). ? Severe cyclonic storm (SCS)
  • 9. LOW PRESSURE AREA-13TH OCT 1985. Source:- Indian Meteorological Dept
  • 10. DEEP DEPRESSION-14TH OCT 1985 Source:- Indian Meteorological Dept
  • 11. SEVERE CYCLONIC STORM-15TH OCT 1985 Source:- Indian Meteorological Dept
  • 12. LANDFALL-16TH OCT 1985 Source:- Indian Meteorological Dept
  • 13. ISOBARIC PROFILE TREND. L D D S C S LAND FALL
  • 14. TRACKS OF TROPICAL CYCLONE & ITS INTENSIFICATION
  • 15. IDENTIFICATION OF DIFFERENT STAGES TYPE OF DISTURBANCE PRESSURE FALL IN hpa NUMBER OF CLOSED ISOBARS MAXIMUM WIND SPEEED IN KNOTS Low Pressure Area--LPA 2 hpa. 1. Not more than 16 knots. Depression-D 4-7 hpa. 3. 17-27 knots. Deep Depression-- DD 8-11 hpa. 4-5. 28-33 knots. Cyclonic Storm- CS 12-16 hpa. 6-8. 34-47 knots. Severe Cyclonic Storms-SCS More than 16 hpa. More than 8. 48-63 knots.
  • 16. LIST OF MAJOR CYCLONES OF INDIA. NAME & YEAR LOWEST PRESSURE WIND SPEED FATALITIES Rameswaram Cyclone of 1964 970 mb 240 km/hr 1800 Bhloa Cyclone of 1970 966 mb 205 km/hr 3 lakh-5 lakh Paradip Super Cyclone of 1999 912 mb 260 km/hr 10000 India Cyclone of 2001 932 mb 215 km/hr 120-900 Cyclone Onil of 2004 990 mb 100 km/hr 300 Cyclone Bijli of 2009 996 mb 75 km/hr 7 Cyclone Aila of 2009 968 mb 120 km/hr 330 Cyclone Nilam of 2012 990 mb 85 km/hr 75 Cyclone Helen of 2013 990 mb 130 km/hr 11 Cyclone Phailin of 2013 940 mb 260 km/hr 45 Cyclone Hudhud of 2014 950 mb 215 km/hr 124 Source¨C Wilkipedia.
  • 17. TREND OF CYCLONES IN INDIAN SEAS Source-India Meteorology Department FAQ - frequencies of Cyclonic systems over north Indian Ocean during 1891-2006
  • 18. IMPACTS OF TROPICAL CYCLONE ? Loss of life & property. ? Crop damage. ? Floods in coastal areas. ? Salinization of land & decline in agricultural production. ? Disruption in transport network system. ? Break out of epidemics.
  • 19. COMPARETIVE ANALYSIS OF ORISSA SUPER CYCLONE (1999) & PHAILIN (2013) PARAMETERS SUPER CYCLONE OF 1999 PHAILIN CYCLONE OF 2013 Date of origin 25 th October 1999 4th October 2013. Date of dissipation 3rd November 1999 14th October 2013. Lowest Pressure 912 mb 940 mb Wind Speed 260 km/hr 260 km/hr Fatalities 10000 45 Damage in terms of US Dollars 4.5 $ ( In terms of 1999 US Dollars) 696 $ ( In terms of 2013 US Dollars). Rank in Sarif Simpson scale 5 5
  • 21. STORMS BEFORE LANDFALL Source- www. indiatoday.intoday. in
  • 22. AREAS AFFECTED. Super Cyclone 1999 Phailin Source:- Reddit.com & kuber-greenteam.blogspot.com
  • 23. PHAILIN OF 2013 Source:- Indian Meteorological Dept
  • 24. SUPER CYCLONE ORISSA 1999 Source:- Indian Meteorological Dept
  • 25. DEVASTATIONS CAUSED BY THE STORMS Courtsey:- Google images
  • 26. WHY SUPER CYCLONE OVERTOPPED PHAILIN IN TERMS OF DEATH TOLLS? ? Super Cyclone of 1999 remained stationary over Paradip coast for about 36 hrs causing more damage while Phailin behaved in a normal way like other tropical cyclones. Besieds, the Orissa Government hardly took the forecasting of the weather office seriously & took preventive steps. Fishermen went to the sea ignoring the warnings of the arriving hazard. However, at the time of Phailin, public awareness, developed forecasting system, use of remote sensing & coordination of various Government agencies acted as a key tool in reducing the death tolls between 30 to 45. Thus, Phailin caused less death tolls than Super Cyclone although both were ranked 5 on the Sarif Simpson scale.
  • 27. BOB-1990 YEMEIN-2007 LAILA-- 2010NISHA-- 2008 JAL--2010 SUPER CYCLONE 1999 ONIL 2004 Source- Wikipedia image
  • 28. YEAR BAY OF BENGAL ARABIAN SEA 1891-1902 116 29 1903-1914 105 22 1915-1926 139 24 1927-1938 159 30 1939-1950 178 36 1951-1962 140 36 1963-1974 154 41 1975-1986 130 55 1987-1998 91 27 1999-2010 83 31 2011-2015 31 22 Source:- IMD.
  • 30. YEAR ANNUAL ON BAY OF BENGAL ANNUAL ON ARABIAN SEA 1999 7 1 2000 6 0 2001 3 3 2002 5 1 2003 6 1 2004 3 5 2005 9 2 2006 10 1 2007 9 3 2008 7 2 2009 5 3 2010 6 2 TOTAL 76 24 Source:- IMD.
  • 38. Source:- ¡°Natural Hazards and their Management in Indian Sub continent¡± pp.66-77 Mishra.S
  • 40. Source¨C Vulnerability Atlas of India by Building Material and Technology Promotion Council (BMTPC), Government of India.
  • 41. District Vulnerability Rank Angul 0.371 26 Balasore 0.591 1 Baragarh 0.419 23 Bhadrak 0.522 4 Bolangir 0.443 20 Boudh 0.439 21 Cuttack 0.450 18 Deogarh 0.443 19 Dhenkanal 0.403 25 Gajapati 0.478 12 Ganjam 0.470 14 Jagatsinghpur 0.471 13 Jajpur 0.552 3 Jharsuguda 0.333 30 Kalahandi 0.498 9 Kandhamal 0.468 15 Kendrapada 0.555 2 Keonjhar 0.456 17 Khurda 0.367 27 Koraput 0.479 11 Malkangiri 0.504 8 Mayu rbhanj 0.467 16 Nabarangpur 0.517 5 Nayagarh 0.417 24 Nuapada 0.505 7 Puri 0.491 10 Rayagada 0.512 6 Sambalpur 0.345 29 Sonepur 0.430 22 Sundargarh 0.363 28 DISTRICT-WISE VULNERABILITY INDEX AND RANK OF ORISSA. Source:- Assessment of vulnerability to cyclones and floods in Orissa, India: a district-level analysis Bahinipati CS, GIDR, Ahmedabad.
  • 44. Source¨C BIS1893 (Part 1), 2002 by Building Material and Technology Promotion Council (BMTPC), Government of India.
  • 46. Source¨C Vulnerability Atlas of India by Building Material and Technology Promotion Council (BMTPC), Government of India