Tuscany Inner Areas strategy An history of participation
ŌĆó
0 likesŌĆó29 views

The document discusses Italy's Inner Areas strategy being implemented in Tuscany. The strategy aims to improve quality of life and opportunities in remote, depopulating areas through improved services, jobs, and sustainable development. Four areas were selected as pilot project areas based on participatory processes. Local strategies were developed through analysis of needs, opportunities, and actions to address both basic "rights" like education and healthcare as well as economic "growth." The strategies seek to leverage areas' strengths while reducing development bottlenecks.


Tuscany Inner Areas strategy An history of participation
- 1. Edinburgh, 11th April 2018 Alessandra de Renzis Tuscany Regional Government, Italy Tuscany Inner Areas strategy An history of participation
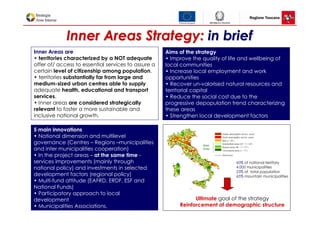
- 2. InnerInner AreasAreas Strategy:Strategy: inin briefbrief Inner Areas are ŌĆó territories characterized by a NOT adequate offer of/ access to essential services to assure a certain level of citizenship among population. ŌĆó territories substantially far from large and medium-sized urban centres able to supply adequate health, educational and transport services. ŌĆó Inner areas are considered strategically relevant to foster a more sustainable and inclusive national growth. Aims of the strategy ŌĆó Improve the quality of life and wellbeing of local communities ŌĆó Increase local employment and work opportunities ŌĆó Recover un-valorised natural resources and territorial capital ŌĆó Reduce the social cost due to the progressive depopulation trend characterizing these areas ŌĆó Strengthen local development factors Ultimate goal of the strategy Reinforcement of demographic structure 5 main innovations ŌĆó National dimension and multilevel governance (Centres ŌĆō Regions ŌĆōmunicipalities and inter municipalities cooperation) ŌĆó In the project areas ŌĆō at the same time - services improvements (mainly through national policy) and investments in selected development factors (regional policy) ŌĆó Multi-fund attitude (EAFRD, ERDF, ESF and National Funds) ŌĆó Participatory approach to local development ŌĆó Municipalities Associations. 60% of national territory 4.000 municipalities 23% of total population 65% mountain municipalities
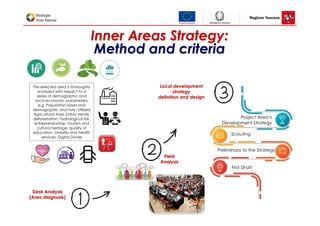
- 3. First Draft Preliminary to the Strategy Scouting InnerInner AreasAreas Strategy:Strategy: MethodMethod andand criteriacriteria Desk AnalysisDesk Analysis (Area diagnosis)(Area diagnosis) Pre-selected area is thoroughly analyzed with respect to a series of demographic and socio-economic parameters: e.g. Population losses and demographic structure, Utilized Agricultural Area (UAA) trends, deforestation, hydrological risk, entrepreneurship, tourism and cultural heritage, quality of education, mobility and health services, Digital Divide FieldField AnalysisAnalysis LocalLocal developmentdevelopment strategystrategy definition and designdefinition and design Project AreaŌĆÖs Development Strategy
- 4. Population: 3.742.437 inhab Area: 23.000 km┬▓ GDP per capita: Ōé¼ 29.466 GDP composition: 73.4% Services; per sector (2015) 24.3% Industry; 2.3% Agriculture (including Fishery and Forestry) Registered companies: approximately 351.000 (ISTAT- 2015) Around 95% of companies have less than 10 employees (ISTAT- 2015) Manufacturing: over 32% of regional workforce (ISTAT- 2015) Employment rate 69,9% Mountain area represents 25% of the territory Hilly landscape is predominant, representing more than 66% Flatland accounts for about 8% Forests cover about 51% of the landscape and are well distributed in the Region Total agricultural surface is about 8.000 Square Km. Population with higher education: 10% R&D expenditure as a % of GDP: 1,36% (40% from private sector) University size: 150.000 students Tuscany in brief:Tuscany in brief: main featuresmain features
- 5. Fragile Inner areas Low potential tourist Inner areas Inner areas with potentiality Residential Inner areas ŌĆśSilver - typeŌĆÖ railway station 2nd level DEA hospital Service Centers and Belt areas 1st level DEA hospital Exhaustive range of secondary schools NationalNational ClassificationClassification (r(ree))DDefiningefining TuscanyTuscany InnerInner AreasAreas RegionalRegional rere--ClassificationClassification
- 6. Selection of project areas:Selection of project areas: backgroundbackground Tuscany has a long history of participatory processes: the first Regional Law dates back 2007 (L.R. n.69/2007 now repealed with L.R. n.46/2013) a pioneer initiative in the Italian and European context and it can be considered one of the first examples of perennial institutionalized social participation guided by deliberative systems theories. Regional Development Programme 2016-2020 foresees the identification of homogeneous territorial areas where carrying out analysis and collection of local needs, together with local Institutions and economic actors. 20072007 JanJan 20152015 JulyJuly 20152015 20162016 The regional Government publishes a call for proposal entrusting the territory to propose a local development strategy based on and able to respond to local population and economic system needs addressing ŌĆ£rightsŌĆØ (i.e. Education, Health-welfare and mobility policies) and ŌĆ£growthŌĆØ (economic development) simultaneously. Size and entity of the participation process are considered as selection criteria. While programming Regional Inner Areas strategy, the regional Government decided that it had to be the territory itself to select, define and promote an aggregation of territories as its strategic area (around a core of weakest areas of the Region identified ŌĆ£ fragileŌĆØ).
- 7. Selection of project areas:Selection of project areas: outcomesoutcomes Garfagnana ŌĆō Lunigiana ŌĆō Media Valle del Serchio ŌĆō Appennino Pistoiese Valdarno-Valdisieve, - Mugello - Valbisenzio Casentino - Valtiberina Val di Cecina Amiata Grossetana - Amiata Val d'Orcia - Colline Metallifere - Colline del Fiora - Val di Chiana Senese - Val di Merse Project Area: 17 Municipalities Strategy Area: 22Municipalities Public partners: 12 Private partners: 15 No. meetings: 13 No. participants: 133 Project Area: 11 Municipalities Strategy Area: 28 Municipalities Public partners: 22 Private partners: 37 No. meetings: 7 No. participants: 156 Project Area: 12 Municipalities Strategy Area: 23 Municipalities Public partners: 23 Private partners: 25 No. meetings: 14 No. participants: 135 Project Area: 4 Municipalities Strategy Area: 1 Municipality Public partners: 10 Private partners: - No. meetings: 1 No. participants: 15
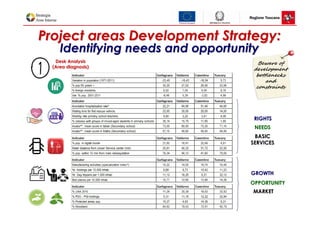
- 8. Project areas Development Strategy:Project areas Development Strategy: Identifying needs and opportunityIdentifying needs and opportunity Desk AnalysisDesk Analysis (Area diagnosis)(Area diagnosis) RIGHTSRIGHTS NEEDSNEEDS GROWTHGROWTH Beware of development bottlenecks and constraints BASICBASIC SERVICESSERVICES OPPORTUNITYOPPORTUNITY MARKETMARKET
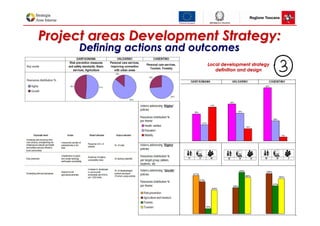
- 9. Project areas Development Strategy:Project areas Development Strategy: DeDefiningfining actionsactions andand outcomesoutcomes LocalLocal development strategydevelopment strategy definition and designdefinition and design
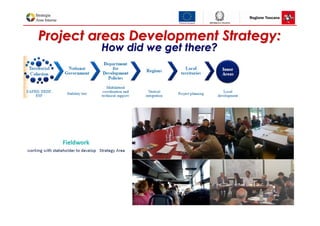
- 10. Project areas Development Strategy:Project areas Development Strategy: HHowow diddid wewe getget therethere??
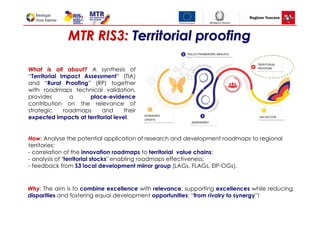
- 11. MTR RIS3:MTR RIS3: Territorial proofingTerritorial proofing HowHow: Analyse the potential application of research and development roadmaps to regional territories: - correlation of the innovation roadmaps to territorial value chains; - analysis of "territorial stocks" enabling roadmaps effectiveness; - feedback from S3 local development mirror group (LAGs, FLAGs, EIP-OGs). WhyWhy: The aim is to combine excellence with relevance, supporting excellences while reducing disparities and fostering equal development opportunities: ŌĆ£from rivalry to synergyŌĆØ! What is all about?What is all about? A synthesis of ŌĆ£Territorial Impact AssessmentŌĆØ (TIA) and ŌĆ£Rural ProofingŌĆØ (RP) together with roadmaps technical validation, provides a place-evidence contribution on the relevance of strategic roadmaps and their expected impacts at territorial level.
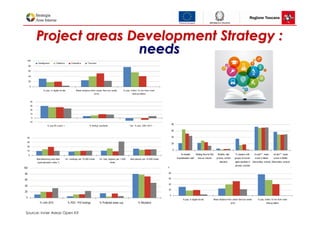
- 13. PProjectroject areasareas DDevelopmentevelopment Strategy :Strategy : needsneeds Source: Inner Areas Open Kit 0 20 40 60 80 100 % pop. in digital div ide Mean distance from closer Serv ice center (min) % pop. w ithin 15 min from main railw ay station Garfagnana Valdarno Casentino Toscana -10 0 10 20 30 40 % pop 65 y ears + % foreign residents Var. % pop. 2001-2011 0 20 40 60 80 100 % UAA 2010 % PDO - PGI holdings % Protected areas sup. % Woodland 0 10 20 30 40 Manufacturing activ ities (specialization index *) Nr. holdings per 10.000 inhab. Nr. Day trippers per 1.000 inhab. Bed places per 10.000 inhab. 0 20 40 60 80 100 % pop. in digital div ide Mean distance from closer Service center (min) % pop. within 15 min from main railwaystation 0 20 40 60 80 Avoidable hospitalisation rate* Waiting time for first rescue v ehicle Mobility rate primary school teachers % clasess with groups of mixed- aged students in primary schools Invalsi**: mean score in Italian (Secondary school) Inv alsi**: mean score in Maths (Secondary school)
- 14. ŌĆ£ŌĆ£Territorial VCsTerritorial VCsŌĆØŌĆØ andand ŌĆ£ŌĆ£Territorial StocksTerritorial StocksŌĆØŌĆØ (1/2)(1/2) Roadmap proximity Direct Subsets containing relevant groups of producers Subsets containing relevant groups of users Indirect Poor Weak or absent link Indirect/supply chain links with other direct subsets Main information from: -Distribution and perfomance indicators; -I/O models; -Labour Market Areas dynamics. COMPETENCES ECONOMIC SYSTEM DEMOGRAPHY INFRASTRUCTURES PUBBLIC SERVICES Good Territorial Stocks Poor Territorial Stocks TVCs TSs
- 15. GOOD POOR DIRECT ┬½Easy winners┬╗ ┬½Obstacle course runners┬╗ INDIRECT Likely adopters ┬½Ball and chain┬╗ adopters POOR Tapped potential? Roadmap proximity Territorial Stocks ŌĆ£ŌĆ£Territorial VCsTerritorial VCsŌĆØŌĆØ andand ŌĆ£ŌĆ£Territorial StocksTerritorial StocksŌĆØŌĆØ (2/2)(2/2) To be discussed with S3 local development mirror group (LAGs, FLAGs, EIP-OGsŌĆ”) TSs TVCs