ݺߣ

ݺߣShare a Scribd company logo
David McCoy


Has the industry reached the bottom?


                                         TZMI Congress/ Asia in focus
                                       Singapore| 22-23 October 2009
Key points about the world
      yp

     Clear “V” shaped downturn for the global market
     Emerging markets strongest growth in 2010
     Destocking complete
     Pigment inventory levels recalibrated –
     production trimmed
     Cost pressures throughout the supply chain –
     TiO2 producers under severe stress


                                     TZMI Congress/ Asia in focus
4
                                   Singapore| 22-23 October 2009
Changing markets for TiO2
        g g
             1980

                                      1990
       18%
                    46%

                                21%
      36%                                                               2000
                                               42%


                                37%                              26%
                                                                                    38%


                                                                    36%

                    Americas   EMEA      Asia-Pacific


                                                     TZMI Congress/ Asia in focus
5
                                                   Singapore| 22-23 October 2009
Demand in 2008
                                      4.72 million tonnes
                        5%                                                     2% 1%
                6%                                                     3% 2%
                                                                 3%
       7%
                                                        9%
                                    24%


                                                                 23%                         57%
                                      23%
    35%


     North America             Western Europe         Coatings                      Plastics
                                                      Paper                         Specialties
     Asia Pacific              Central Europe
                                                      Inks                          Fibres
     Central & South America   Middle East & Africa   Rubber                        Food & Pharmaceuticals


                                                                    TZMI Congress/ Asia in focus
6
                                                                  Singapore| 22-23 October 2009
TiO2 pigment supply changes
          pg        pp y     g
                                                                         1998
           4%        14%                              Chloride 60%, Sulfate 40%
      4%                           23%
                                    3%
                                                      Outlook for chloride grow at expense of sulfate
     4%
                                                      5 largest produced 73.7% of global market
                                     18%
                                                      ISK produced 20% of Asia-Pacific market
     11%              13%     9%
                                                      China
                                                      Chi produced 18% of Asia Pacific market
                                                             d   d      f A i P ifi       k

    DuPont                        Cristal Global
    Tronox
    Kronos
                                  Huntsman Tioxide
                                  Sachtleben Kemira
                                                                         2008
    Ishihara Sangyo Kaisha        Chinese
    Others                                            Chl id 57%, Sulfate 43%
                                                      Chloride 57% S lf t

                       10%                            Sulfate the dominant growth platform, but
                                  19%                 everyone still wants chloride technology
                16%
                                                      5 largest produced 66.0% of global market
                                        15%           ISK produced 11% of Asia-Pacific market
      4%
      4%                           12%                China produced 52% of Asia Pacific market
                             9%
           11%


                                                                   TZMI Congress/ Asia in focus
7
                                                                 Singapore| 22-23 October 2009
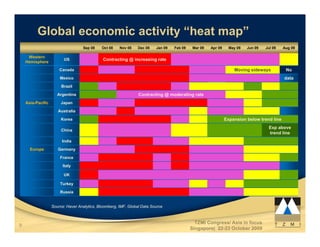
Global economic activity “heat map”
                                   Sep 08    Oct 08    Nov 08   Dec 08    Jan 09   Feb 09    Mar 09   Apr 09     May 09   Jun 09   Jul 09   Aug 09

     Western
                         US                   Contracting @ increasing rate
    Hemisphere
                       Canada                                                                                      Moving sideways           No
                       Mexico
                       M i                                                                                                                  data
                                                                                                                                            d t
                        Brazil

                      Argentina                                  Contracting @ moderating rate
    Asia-Pacific        Japan

                      Australia

                        Korea                                                                                  Expansion below trend line
                                                                                                                                    Exp above
                        China
                                                                                                                                    trend line
                        India

      Europe          Germany

                       France

                         Italy

                         UK

                       Turkey

                       Russia


                   Source: Haver Analytics, Bloomberg, IMF, Global Data Source


                                                                                              TZMI Congress/ Asia in focus
9
                                                                                            Singapore| 22-23 October 2009
IMF 2010 GDP forecasts
     Eurozone                    0.3
                      -0.3
          UK                           0.9
                                       09
                                 0.2
           US                                 1.5
                                       0.8
        Japan                                    1.7
                                               1.7
                                               17
         India                                                                            6.4
                                                                                         6.5
        China                                                                                               9.0
                                                                                                     8.5
     Advanced
     Ad     d                                1.3
                                             13
                                   0.6
     Emerging                                                                  5.1
                                                                         4.7
        World                                                  3.1
                                                         2.5
                 -2          0                     2                 4               6          8                 10

                                                       % change year-on-year

                                               Oct-09
                                               Oct 09          Jul-09
                                                               Jul 09


                                                                             TZMI Congress/ Asia in focus
10
                                                                           Singapore| 22-23 October 2009
Emerging markets – key for g
             g g              y     growth
                                                              Mature                                         Emerging
                                                             Per Capita                                      Per Capita

                  Architectural                                                                                              < 2 litres
                                                                                  8 litres
                  Paint


                  Industrial and Special
                                                                                  13 litres                                  < 6 litres
                  Purpose Coatings


                   Plastics                                                       ~100 kg                                    ~20 kg


                  Paper
                  P                                               ~170 k
                                                                   170 kg                                           ~25 kg


     Source: Food & Agriculture Organization of the UN, 2005 data for paper and paperboard; Plastic Europe Market
     Research Group (PEMRG) 2005 plastics data; Euromonitor 2007 coatings data; WorldBank population data


                                                                                                         TZMI Congress/ Asia in focus
12
                                                                                                       Singapore| 22-23 October 2009
Coatings raw materials
           g


                         5%
                                12%           Additives
                        27%     12%
                                              Solvents
                                32%
                        38%
                                              TiO2 / Pigments / Fillers

                                44%
                        31%
                                              Resins


                       Volume   Spend


                                  TZMI Congress/ Asia in focus
13
                                Singapore| 22-23 October 2009
Largest coatings companies - 2008
        g          g     p
      Revenue
      US$ billions


      16
      14
      12
      10
       8
       6
       4
       2
       0


                                                                                                     Masco
                                                                                            Kansai
                                                                Valspar
                         PPG
            Nobel


                                   SHW


                                                                          RPM
                                                BASF


                                                                                   Nippon
                                                       DuPont
            Akzo


      Source: Company reports, TZMI estimates


                                                                            TZMI Congress/ Asia in focus
14
                                                                          Singapore| 22-23 October 2009
Revenue-based market share 2008


                                                                      achtleben
                                                 Huntsman


                                                                                                     Jinhong
                                                                                          Billions
            DuPont


                                                            Kronos


                                                                                                                omon
                                      ronox
                        Cristal


                                                                                   SK


                                                                                                               Lo
                                                                     Sa


                                                                                  IS
                                     Tr
     100%                                                                                                              100%
      90%                                                                                                              90%
      80%                                                                                                              80%
      70%                                                                                                              70%
      60%                                                                                                              60%
      50%                                                                                                              50%
      40%                                                                                                              40%
      30%                                                                                                              30%
      20%                                                                                                              20%
      10%                                                                                                              10%
      0%                                                                                                               0%


                                                                                                               Masco
                                                                                                     Kansai
                                                                     Valspar
                        PPG


                                                                                  RPM
            Akz Nobel


                                     SHW


                                                 BASF


                                                                                          Nippon
                                                            DuPont
              zo


                           Source: Company reports, TZMI database

                                                                                      TZMI Congress/ Asia in focus
15
                                                                                    Singapore| 22-23 October 2009
Long term TiO2 pigment demand growth
        g           pg             g
     ‘000 tonnes

     2,000
     1,800                                                                                                                  3.0% CAGR
                                                                                                                            1.7% CAGR
     1,600
                                                                                                                            5.5% CAGR
     1,400
     1,200
     1,000
      800
      600
      400
      200
        0
              1980

                      1982

                               1984

                                      1986

                                             1988

                                                    1990

                                                             1992

                                                                    1994

                                                                           1996

                                                                                  1998

                                                                                         2000

                                                                                                2002

                                                                                                       2004

                                                                                                              2006

                                                                                                                     2008
                                       EMEA                Americas
                                                           A   i              Asia-Pacific
                                                                              A i P ifi
       Source: TZMI Database


                                                                                      TZMI Congress/ Asia in focus
16
                                                                                    Singapore| 22-23 October 2009
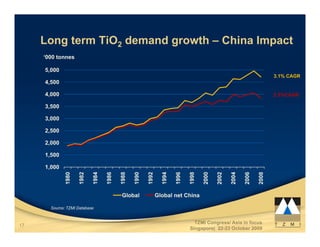
Long term TiO2 demand growth – China Impact
        g                  g                p
     ‘000 tonnes

     5,000
                                                                                                                         3.1%
                                                                                                                         3 1% CAGR
     4,500

     4,000                                                                                                               2.5%CAGR

     3,500

     3,000

     2,500

     2,000

     1,500

     1,000
              1980

                     1982

                            1984

                                   1986

                                          1988

                                                 1990

                                                        1992

                                                                 1994

                                                                        1996

                                                                               1998

                                                                                      2000

                                                                                             2002

                                                                                                    2004

                                                                                                           2006

                                                                                                                  2008
                                          Global               Global net China

       Source: TZMI Database


                                                                                 TZMI Congress/ Asia in focus
17
                                                                               Singapore| 22-23 October 2009
Long term demand growth – Looking forward
        g             g              g
     ‘000 tonnes

     6,000                                                                                                                                3.2%
                                                                                                                                          3 2% CAGR


     5,500

     5,000

     4,500                                                                                                                                1.8% CAGR


     4,000
      ,

     3,500

     3,000
                  2000

                         2001

                                2002

                                       2003

                                              2004

                                                     2005

                                                            2006

                                                                   2007

                                                                          2008

                                                                                 2009f

                                                                                          2010f


                                                                                                          2012f

                                                                                                                  2013f

                                                                                                                          2014f

                                                                                                                                  2015f
                                                                                                  2011f
                                Global               Global net China                       30 yr trendline
       Source: TZMI Database


                                                                                           TZMI Congress/ Asia in focus
21
                                                                                         Singapore| 22-23 October 2009
China in the world: Demand
     Cumulative
     incremental demand
     (‘000 tonnes)

     1,600
     1 600                                                                                          60%

     1,400                                                                                          53%
                                                                  44%
     1,200                                                                                          45%
                                                                                           42%
                                38%                       39%                   41%
     1,000                                                                                          38%

       800                                 32%                                                      30%

       600                                                                                          23%
                                                                                                      %

       400                                                                                          15%

       200                                                                                          8%

         0                                                                                          0%
                2009f      2010f      2011f       2012f         2013f      2014f      2015f


         ROW       Chinese exports    China domestic      China % of world growth


                                                                     TZMI Congress/ Asia in focus
23
                                                                   Singapore| 22-23 October 2009
* Greenfields including chloride conversions
                                                                                                                                                                       ** Excludes brownfields expansions and all Chinese plants
                                                                                                                                                                  1. Osaka was re-opened in 1999, but completely closed in 2004

Major
M j capacity changes**
         it h       **
               ‘000 tonnes                                                                                                                                                                                                                              Price index 2008 real
200                                                                                                                                                                                                                                                                      180


                                                                                                                                                                                        more Sulfate
                                                                           Teluk Kalung,


150                                                                                               Kua Yin
                                                                                                                                                                                                                                                                         160
                                                                                                                                          ©TZMI
                                                                                                    an


                                                                                                                                                                                                                                     te
                     Kemerton, Botlek
                                    k


                                                                                                                                                                          Antwerp, Baltim


                                                                                                                                                                                                                       Savannah Sulfat
100                                                                                                                                                                                                                                                                      140
                                                                                                                     Stallingborough

                                                                                                                                       Onsan


                                                                                                                                                                                                                                                               Lehavre
 50                                                                                                                                                                                                                                                                      120

     0                                                                                                                                                                                                                                                                   100
                                                         Kwinana, Yanbu,
                                                            Lake Charles
         Varennes

                    Jurong

                                          Langerbrugge


                                                                                                            Osaka1


                                                                                                                                        Antioch


                                                                                                                                                          Akita

 -50                                                                                                                                                                                                                                                                     80
                                                                           Tracey


                                                                                                                       Burnie
                                                         K


-100                                                                                                                                                                                                                                                                     60
         1988

                     1989

                                          1990

                                                              1991

                                                                           1992

                                                                                           1993

                                                                                                  1994

                                                                                                            1995

                                                                                                                       1996

                                                                                                                                       1997

                                                                                                                                                  1998

                                                                                                                                                          1999

                                                                                                                                                                   2000

                                                                                                                                                                              2001

                                                                                                                                                                                                       2002

                                                                                                                                                                                                              2003

                                                                                                                                                                                                                       2004

                                                                                                                                                                                                                                          2005

                                                                                                                                                                                                                                                 2006

                                                                                                                                                                                                                                                        2007

                                                                                                                                                                                                                                                               2008
                                                                Greenfields plants                                                                       Closures                                              TiO2 price
                                        Source: TZMI database


                                                                                                                                                                                                                       TZMI Congress/ Asia in focus
26
                                                                                                                                                                                                                     Singapore| 22-23 October 2009
In summary
              y

      The worst is probably behind us, although the
      rebound in mature markets will take longer
      Economic outlook to 2010 is looking more
      positive with each forecast
      Restocking will drive Q1 demand and maybe
      some Q4 demand if price increases look to flow
      through in early 2010
      Rebound in pricing to begin in early 2010 and
      continue through to 2012.


                                      TZMI Congress/ Asia in focus
28
                                    Singapore| 22-23 October 2009
In summary
              y

      Consolidation in the pigment and coatings sector
      is likely to continue.
      No greenfields TiO2 plants outside of China for at
            2-3 years.
      least 2 3 years
      China’s domestic market should not be
      underestimated – two tier pricing structure to
      continue for several years.


                                       TZMI Congress/ Asia in focus
29
                                     Singapore| 22-23 October 2009
Helping the global titanium and
zircon industries to achieve maximum
         value from resources.


                                TZMI Congress/ Asia in focus
                              Singapore| 22-23 October 2009

More Related Content

TZMI Oct 09 TiO2 Presentation Singapore

  • 1. David McCoy Has the industry reached the bottom? TZMI Congress/ Asia in focus Singapore| 22-23 October 2009
  • 2. Key points about the world yp Clear “V” shaped downturn for the global market Emerging markets strongest growth in 2010 Destocking complete Pigment inventory levels recalibrated – production trimmed Cost pressures throughout the supply chain – TiO2 producers under severe stress TZMI Congress/ Asia in focus 4 Singapore| 22-23 October 2009
  • 3. Changing markets for TiO2 g g 1980 1990 18% 46% 21% 36% 2000 42% 37% 26% 38% 36% Americas EMEA Asia-Pacific TZMI Congress/ Asia in focus 5 Singapore| 22-23 October 2009
  • 4. Demand in 2008 4.72 million tonnes 5% 2% 1% 6% 3% 2% 3% 7% 9% 24% 23% 57% 23% 35% North America Western Europe Coatings Plastics Paper Specialties Asia Pacific Central Europe Inks Fibres Central & South America Middle East & Africa Rubber Food & Pharmaceuticals TZMI Congress/ Asia in focus 6 Singapore| 22-23 October 2009
  • 5. TiO2 pigment supply changes pg pp y g 1998 4% 14% Chloride 60%, Sulfate 40% 4% 23% 3% Outlook for chloride grow at expense of sulfate 4% 5 largest produced 73.7% of global market 18% ISK produced 20% of Asia-Pacific market 11% 13% 9% China Chi produced 18% of Asia Pacific market d d f A i P ifi k DuPont Cristal Global Tronox Kronos Huntsman Tioxide Sachtleben Kemira 2008 Ishihara Sangyo Kaisha Chinese Others Chl id 57%, Sulfate 43% Chloride 57% S lf t 10% Sulfate the dominant growth platform, but 19% everyone still wants chloride technology 16% 5 largest produced 66.0% of global market 15% ISK produced 11% of Asia-Pacific market 4% 4% 12% China produced 52% of Asia Pacific market 9% 11% TZMI Congress/ Asia in focus 7 Singapore| 22-23 October 2009
  • 6. Global economic activity “heat map” Sep 08 Oct 08 Nov 08 Dec 08 Jan 09 Feb 09 Mar 09 Apr 09 May 09 Jun 09 Jul 09 Aug 09 Western US Contracting @ increasing rate Hemisphere Canada Moving sideways No Mexico M i data d t Brazil Argentina Contracting @ moderating rate Asia-Pacific Japan Australia Korea Expansion below trend line Exp above China trend line India Europe Germany France Italy UK Turkey Russia Source: Haver Analytics, Bloomberg, IMF, Global Data Source TZMI Congress/ Asia in focus 9 Singapore| 22-23 October 2009
  • 7. IMF 2010 GDP forecasts Eurozone 0.3 -0.3 UK 0.9 09 0.2 US 1.5 0.8 Japan 1.7 1.7 17 India 6.4 6.5 China 9.0 8.5 Advanced Ad d 1.3 13 0.6 Emerging 5.1 4.7 World 3.1 2.5 -2 0 2 4 6 8 10 % change year-on-year Oct-09 Oct 09 Jul-09 Jul 09 TZMI Congress/ Asia in focus 10 Singapore| 22-23 October 2009
  • 8. Emerging markets – key for g g g y growth Mature Emerging Per Capita Per Capita Architectural < 2 litres 8 litres Paint Industrial and Special 13 litres < 6 litres Purpose Coatings Plastics ~100 kg ~20 kg Paper P ~170 k 170 kg ~25 kg Source: Food & Agriculture Organization of the UN, 2005 data for paper and paperboard; Plastic Europe Market Research Group (PEMRG) 2005 plastics data; Euromonitor 2007 coatings data; WorldBank population data TZMI Congress/ Asia in focus 12 Singapore| 22-23 October 2009
  • 9. Coatings raw materials g 5% 12% Additives 27% 12% Solvents 32% 38% TiO2 / Pigments / Fillers 44% 31% Resins Volume Spend TZMI Congress/ Asia in focus 13 Singapore| 22-23 October 2009
  • 10. Largest coatings companies - 2008 g g p Revenue US$ billions 16 14 12 10 8 6 4 2 0 Masco Kansai Valspar PPG Nobel SHW RPM BASF Nippon DuPont Akzo Source: Company reports, TZMI estimates TZMI Congress/ Asia in focus 14 Singapore| 22-23 October 2009
  • 11. Revenue-based market share 2008 achtleben Huntsman Jinhong Billions DuPont Kronos omon ronox Cristal SK Lo Sa IS Tr 100% 100% 90% 90% 80% 80% 70% 70% 60% 60% 50% 50% 40% 40% 30% 30% 20% 20% 10% 10% 0% 0% Masco Kansai Valspar PPG RPM Akz Nobel SHW BASF Nippon DuPont zo Source: Company reports, TZMI database TZMI Congress/ Asia in focus 15 Singapore| 22-23 October 2009
  • 12. Long term TiO2 pigment demand growth g pg g ‘000 tonnes 2,000 1,800 3.0% CAGR 1.7% CAGR 1,600 5.5% CAGR 1,400 1,200 1,000 800 600 400 200 0 1980 1982 1984 1986 1988 1990 1992 1994 1996 1998 2000 2002 2004 2006 2008 EMEA Americas A i Asia-Pacific A i P ifi Source: TZMI Database TZMI Congress/ Asia in focus 16 Singapore| 22-23 October 2009
  • 13. Long term TiO2 demand growth – China Impact g g p ‘000 tonnes 5,000 3.1% 3 1% CAGR 4,500 4,000 2.5%CAGR 3,500 3,000 2,500 2,000 1,500 1,000 1980 1982 1984 1986 1988 1990 1992 1994 1996 1998 2000 2002 2004 2006 2008 Global Global net China Source: TZMI Database TZMI Congress/ Asia in focus 17 Singapore| 22-23 October 2009
  • 14. Long term demand growth – Looking forward g g g ‘000 tonnes 6,000 3.2% 3 2% CAGR 5,500 5,000 4,500 1.8% CAGR 4,000 , 3,500 3,000 2000 2001 2002 2003 2004 2005 2006 2007 2008 2009f 2010f 2012f 2013f 2014f 2015f 2011f Global Global net China 30 yr trendline Source: TZMI Database TZMI Congress/ Asia in focus 21 Singapore| 22-23 October 2009
  • 15. China in the world: Demand Cumulative incremental demand (‘000 tonnes) 1,600 1 600 60% 1,400 53% 44% 1,200 45% 42% 38% 39% 41% 1,000 38% 800 32% 30% 600 23% % 400 15% 200 8% 0 0% 2009f 2010f 2011f 2012f 2013f 2014f 2015f ROW Chinese exports China domestic China % of world growth TZMI Congress/ Asia in focus 23 Singapore| 22-23 October 2009
  • 16. * Greenfields including chloride conversions ** Excludes brownfields expansions and all Chinese plants 1. Osaka was re-opened in 1999, but completely closed in 2004 Major M j capacity changes** it h ** ‘000 tonnes Price index 2008 real 200 180 more Sulfate Teluk Kalung, 150 Kua Yin 160 ©TZMI an te Kemerton, Botlek k Antwerp, Baltim Savannah Sulfat 100 140 Stallingborough Onsan Lehavre 50 120 0 100 Kwinana, Yanbu, Lake Charles Varennes Jurong Langerbrugge Osaka1 Antioch Akita -50 80 Tracey Burnie K -100 60 1988 1989 1990 1991 1992 1993 1994 1995 1996 1997 1998 1999 2000 2001 2002 2003 2004 2005 2006 2007 2008 Greenfields plants Closures TiO2 price Source: TZMI database TZMI Congress/ Asia in focus 26 Singapore| 22-23 October 2009
  • 17. In summary y The worst is probably behind us, although the rebound in mature markets will take longer Economic outlook to 2010 is looking more positive with each forecast Restocking will drive Q1 demand and maybe some Q4 demand if price increases look to flow through in early 2010 Rebound in pricing to begin in early 2010 and continue through to 2012. TZMI Congress/ Asia in focus 28 Singapore| 22-23 October 2009
  • 18. In summary y Consolidation in the pigment and coatings sector is likely to continue. No greenfields TiO2 plants outside of China for at 2-3 years. least 2 3 years China’s domestic market should not be underestimated – two tier pricing structure to continue for several years. TZMI Congress/ Asia in focus 29 Singapore| 22-23 October 2009
  • 19. Helping the global titanium and zircon industries to achieve maximum value from resources. TZMI Congress/ Asia in focus Singapore| 22-23 October 2009