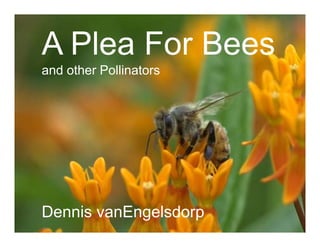
Una s¨²plica por las abejas - Dennis van Engelsdorp
- 1. A Plea For Bees and other Pollinators Dennis vanEngelsdorp
- 12. Symptoms?of?CCD Symptoms of CCD ?Absence of dead bees Absence ?When bees present ?Appear young ?Queen right ?Insufficient brood cover I ffi i t b d vanEngelsdorp, et. al (2009) PLOSone ?Lack of/delayed robbing or common Williams, Tarpy, vanEngelsdorp et. al (2010) comb pests BioEssays
- 15. Proposed Causes?of?CCD C. V ? Cell?Phones C ll Ph Vorsek ? Rapture ? Terrorist ? Russian?plot Russian plot
- 16. Top Lines of Investigation Top?Lines?of?Investigation 1. Pathogen 1. New 2. Newly evolved Newly?evolved 2. Pesticide 1. Beekeeper?applied 2. 2 Farmer?applied li d 3. Environmental?stress 1. Nutrition 2. Genetics 3. Management
- 17. Sample?Collection p Yard?Type Colony type Strong N 9 Control Weak 6 Strong 24 Weak 30 CCD Dead 14 Recovering 6 Package?added 8 Package installed 3
- 18. CCD vs. non-CCD yards M t lit 20 8 % vs 8 1% Mortality 20.8 8.1% Odds Ratio: weak-weak 205 dead- weak weak 205, dead dead 109 vanEngelsdorp, et. al (2009) PLOSone
- 19. vanEngelsdorp
- 20. Higher levels in CCD Non-CCD Non CCD colonies Pathogens ?DWV, KBV , ?2.6 X more likely to have both nosema species ?~2 X more likely to be infected with 3 or more viruses CCD vanEngelsdorp, et. al (2009) PLOSone
- 21. Non-CCD Non CCD CCD Higher levels in control colonies Pesticides ?Coumaphos ?wax and brood wax ?Esfenvalerate ?Wax ?Honey bee tracheal mites vanEngelsdorp, et. al (2009) PLOSone
- 22. CLASSIFICATION AND REGRESSION TREE ANALYSIS N = 91 56.7% 56 7% CCD Coumaphos in bee brood ¡Ü 66 ppb oumaphos in bee brood > 66 ppb C N = 58 N = 33 67.2% CCD 36.4% CCD Fluctuating asymmetry Fluctuating asymmetry ¡Ü 1878.5 > 1878.5 N = 40 N = 18 85.0% CCD 27.8% CCD Tree Sensitivity = 65 % Tree Specificity = 87 % vanEngelsdorp, et. al (2010) J. Ec.Ent
- 23. Bees?are?in?Trouble Bees are in Trouble
- 25. Varroa?Mites Varroa Mites M F
- 35. Bees?are?Dying y g How?to?Care?
- 37. Honey?Hunting y g ? Still?practiced?today ¨C Notably?A.?dorsata?
- 44. Make meadows not lawns
- 45. The Green Lawn
- 47. Thank?You Thank You Humboldt?Institute Humboldt Institute ? Pollinator.org ? X Xereces.org


