Unit 1 chapter 2
- 1. AP Economics Unit 1 Chapter 2 Trade-offs and Trade
- 2. Review 1. Explain Scarcity. 2. Differentiate between positive and normative. 3. Define opportunity cost. 4. What is a resource? 5. Name 10 different teachers at RWHS.
- 3. I. The Production Possibilities Frontier (curve) a) Illustration of the trade-offs facing an economy that produces only two goods. Shows the maximum quantity of one good that can be produced for any given production of the other.
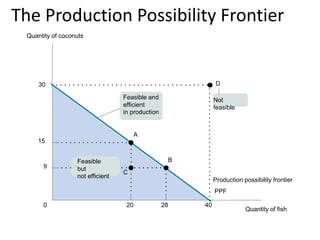
- 4. The Production Possibility Frontier 2820 400 30 9 15 Quantity of coconuts Production possibility frontier A B D C Feasible and efficient in production Not feasible PPF Quantity of fish Feasible but not efficient
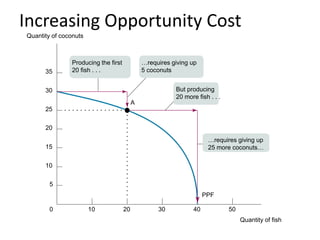
- 5. Increasing Opportunity Cost A PPF 10 20 30 40 500 35 30 25 20 15 10 5 Producing the first 20 fish . . . âĶrequires giving up 25 more coconutsâĶ âĶrequires giving up 5 coconuts But producing 20 more fish . . . Quantity of coconuts Quantity of fish
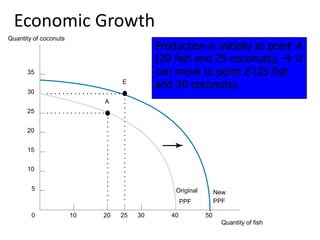
- 6. Economic Growth Economic growth results in an outward shift of the PPF because production possibilities are expanded. The economy can now produce more of everything. Production is initially at point A (20 fish and 25 coconuts), ï it can move to point E (25 fish and 30 coconuts). A 10 20 25 30 40 500 35 30 25 20 15 10 5 E New PPF Original PPF Quantity of coconuts Quantity of fish
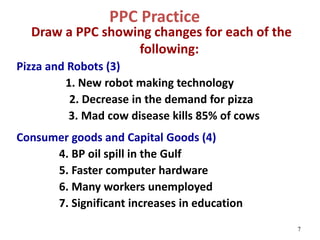
- 7. PPC Practice Draw a PPC showing changes for each of the following: Pizza and Robots (3) 1. New robot making technology 2. Decrease in the demand for pizza 3. Mad cow disease kills 85% of cows Consumer goods and Capital Goods (4) 4. BP oil spill in the Gulf 5. Faster computer hardware 6. Many workers unemployed 7. Significant increases in education 7
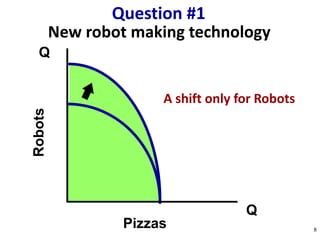
- 8. New robot making technology Q Q Robots Pizzas Question #1 8 A shift only for Robots
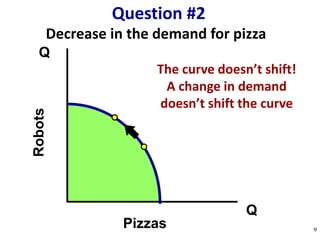
- 9. Decrease in the demand for pizza Q Q Robots Pizzas Question #2 9 The curve doesnât shift! A change in demand doesnât shift the curve
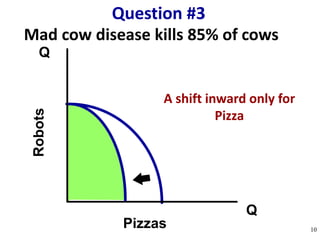
- 10. Mad cow disease kills 85% of cows Q Q Robots Pizzas Question #3 10 A shift inward only for Pizza
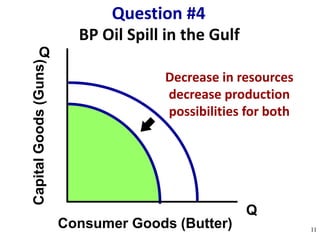
- 11. BP Oil Spill in the Gulf Q Q CapitalGoods(Guns) Consumer Goods (Butter) Question #4 11 Decrease in resources decrease production possibilities for both
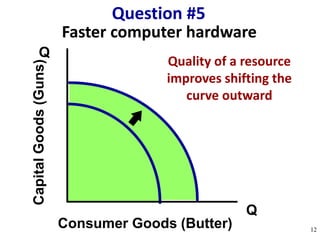
- 12. Faster computer hardware Q Q CapitalGoods(Guns) Consumer Goods (Butter) Question #5 12 Quality of a resource improves shifting the curve outward
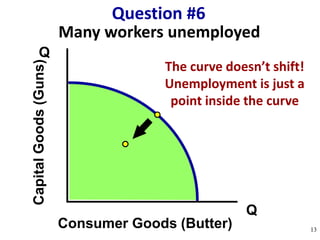
- 13. Many workers unemployed Q Q CapitalGoods(Guns) Consumer Goods (Butter) Question #6 13 The curve doesnât shift! Unemployment is just a point inside the curve
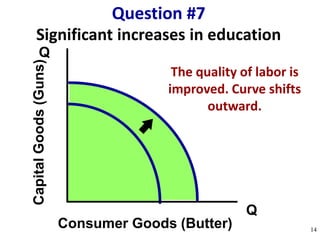
- 14. Significant increases in education Q Q CapitalGoods(Guns) Consumer Goods (Butter) Question #7 14 The quality of labor is improved. Curve shifts outward.
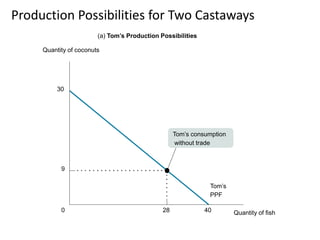
- 15. Production Possibilities for Two Castaways 28 400 30 9 (a) Tomâs Production Possibilities Tomâs consumption without trade Tomâs PPF Quantity of coconuts Quantity of fish
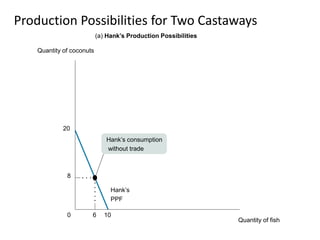
- 16. Production Possibilities for Two Castaways 1060 20 8 Hankâs PPF Quantity of coconuts Quantity of fish (a) Hankâs Production Possibilities Hankâs consumption without trade
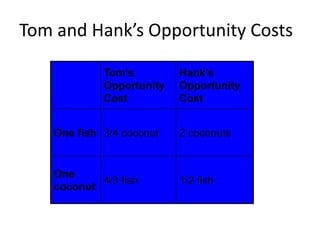
- 17. Tom and Hankâs Opportunity Costs Tomâs Opportunity Cost Hankâs Opportunity Cost One fish 3/4 coconut 2 coconuts One coconut 4/3 fish 1/2 fish
- 18. Specialize and Trade a) Both castaways are better off when they each specialize in what they are good at and trade.
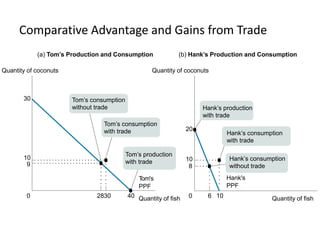
- 19. Comparative Advantage and Gains from Trade 28 400 30 9 10 1060 20 8 10 (a) Tomâs Production and Consumption Tomâs consumption without trade 30 Tom's PPF Hank's PPF Quantity of coconuts Quantity of coconuts Quantity of fishQuantity of fish Tomâs consumption with trade Tomâs production with trade (b) Hankâs Production and Consumption Hankâs production with trade Hankâs consumption with trade Hankâs consumption without trade
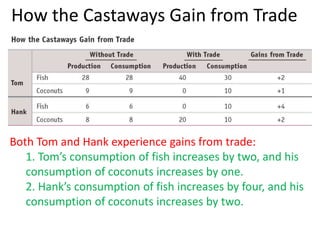
- 20. How the Castaways Gain from Trade Both Tom and Hank experience gains from trade: 1. Tomâs consumption of fish increases by two, and his consumption of coconuts increases by one. 2. Hankâs consumption of fish increases by four, and his consumption of coconuts increases by two.
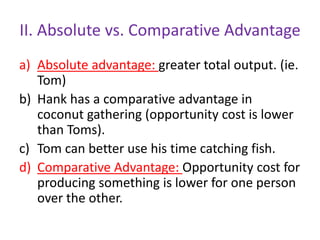
- 21. II. Absolute vs. Comparative Advantage a) Absolute advantage: greater total output. (ie. Tom) b) Hank has a comparative advantage in coconut gathering (opportunity cost is lower than Toms). c) Tom can better use his time catching fish. d) Comparative Advantage: Opportunity cost for producing something is lower for one person over the other.
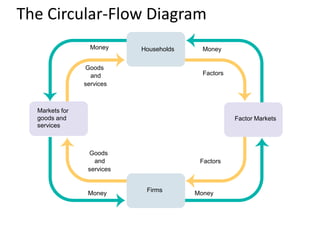
- 22. III. The Circular-Flow Diagram a) Model that represents the transactions in an economy by flows around a circle.
- 23. The Circular-Flow Diagram Money Factors Goods and services Factors Households Firms Factor Markets Goods and services Money Money Money
- 24. Circular-Flow cont. a) Household: a person or groups of people that share their income. b) Firm: Organization that produces goods and services for sale. c) Firms sell goods and services in the product market. d) Firms buy resources they need to produce in the factor market.
Editor's Notes
- #5: Figure Caption: Figure 2.1 - The Production Possibility Frontier The production possibility frontier illustrates the trade-offs facing an economy that produces two goods. It shows the maximum quantity of one good that can be produced given the quantity of the other good produced. Here, the maximum quantity of coconuts that Tom can gather depends on the quantity of fish he catches, and vice versa. His feasible production is shown by the area inside or on the curve. Production at point C is feasible but not efficient. Points A and B are feasible and efficient in production, but point D is not feasible.
- #6: Figure Caption: Figure 2.2 - Increasing Opportunity Cost The bowed-out shape of the production possibility frontier reflects increasing opportunity cost. In this example, to produce the first 20 fish, Tom must give up 5 coconuts. But to produce an additional 20 fish, he must give up 25 more coconuts.
- #7: Figure 2.3 - Economic Growth Economic growth results in an outward shift of the production possibility frontier because production possibilities are expanded. The economy can now produce more of everything. For example, if production is initially at point A (20 fish and 25 coconuts), it could move to point E (25 fish and 30 coconuts).
- #16: Figure Caption: Figure 2.4 - Production Possibilities for Two Castaways Here, each of the two castaways has a constant opportunity cost of fish and a straight-line production possibility frontier. In Tomâs case, each fish always has an opportunity cost of 3â4 of a coconut.
- #17: Figure Caption: Figure 2.4 - Production Possibilities for Two Castaways Here, each of the two castaways has a constant opportunity cost of fish and a straight-line production possibility frontier. In Hankâs case, each fish always has an opportunity cost of 2 coconuts.
- #20: Figure Caption: Figure 2-5: Comparative Advantage and Gains from Trade By specializing and trading, the two castaways can produce By specializing and trading, the two castaways can produce and consume more of both goods. Tom specializes in catching fish, his comparative advantage, and Hankâ who has an absolute disadvantage in both goods but a comparative advantage in coconutsâspecializes in gathering coconuts. The result is that each castaway can consume more of both goods than either could without trade.
- #24: Figure Caption: Figure 2.7: The Circular-Flow Diagram This diagram represents the flows of money and goods and services in the economy. In the markets for goods and services, households purchase goods and services from firms, generating a flow of money to the firms and a flow of goods and services to the households. The money flows back to households as firms purchase factors of production from the households in factor markets.