Unobtrusive Usability Testing: Creating Measurable Goals to Evaluate a Website
ŌĆóDownload as PPTX, PDFŌĆó
2 likesŌĆó1,393 views

Presented at the 2013 ACRL Conference. Full paper available at: http://www.ala.org/acrl/sites/ala.org.acrl/files/content/conferences/confsandpreconfs/2013/papers/Farney_Unobtrusive.pdf
Unobtrusive Usability Testing: Creating Measurable Goals to Evaluate a Website
- 1. The Unobtrusive ŌĆ£Usability TestŌĆØ: Creating Measurable Goals to Evaluate a Website Tabatha Farney Web Services Librarian University of Colorado Colorado Springs Paper at: http://www.ala.org/acrl/sites/ala.org.acrl/files/content/conferen ces/confsandpreconfs/2013/papers/Farney_Unobtrusive.pdf Presented at the 2013 ACRL Conference.
- 2. Usability is a constant process How can we keep up with the pace of changing library users?
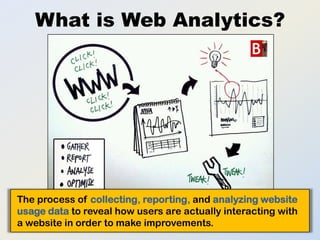
- 3. What is Web Analytics? The process of collecting, reporting, and analyzing website usage data to reveal how users are actually interacting with a website in order to make improvements.
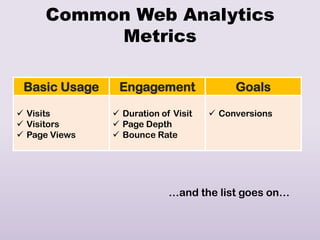
- 4. Common Web Analytics Metrics Basic Usage Engagement Goals ’ā╝ Visits ’ā╝ Duration of Visit ’ā╝ Conversions ’ā╝ Visitors ’ā╝ Page Depth ’ā╝ Page Views ’ā╝ Bounce Rate ŌĆ”and the list goes onŌĆ”
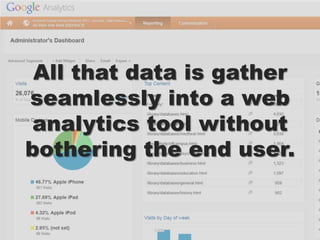
- 5. All that data is gather seamlessly into a web analytics tool without bothering the end user.
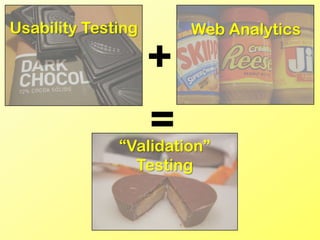
- 6. Usability Testing Web Analytics + = ŌĆ£ValidationŌĆØ Testing
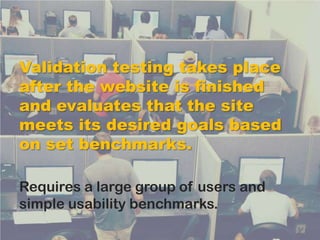
- 7. Validation testing takes place after the website is finished and evaluates that the site meets its desired goals based on set benchmarks. Requires a large group of users and simple usability benchmarks.
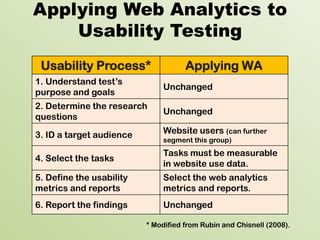
- 8. Applying Web Analytics to Usability Testing Usability Process* Applying WA 1. Understand testŌĆÖs Unchanged purpose and goals 2. Determine the research Unchanged questions 3. ID a target audience Website users (can further segment this group) Tasks must be measurable 4. Select the tasks in website use data. 5. Define the usability Select the web analytics metrics and reports metrics and reports. 6. Report the findings Unchanged * Modified from Rubin and Chisnell (2008).
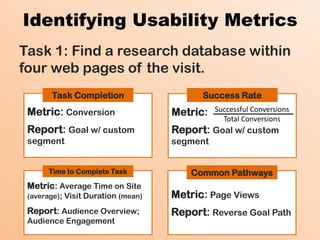
- 9. Identifying Usability Metrics Task 1: Find a research database within four web pages of the visit. Task Completion Success Rate Metric: Conversion Metric: Successful Conversions Total Conversions Report: Goal w/ custom Report: Goal w/ custom segment segment Time to Complete Task Common Pathways Metric: Average Time on Site (average); Visit Duration (mean) Metric: Page Views Report: Audience Overview; Report: Reverse Goal Path Audience Engagement
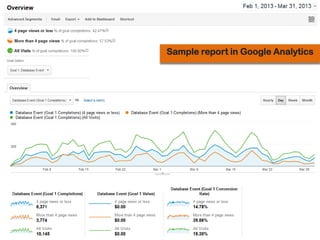
- 10. Example Report Sample report in Google Analytics
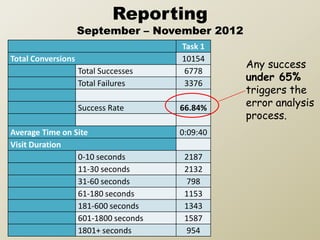
- 11. Reporting September ŌĆō November 2012 Task 1 Total Conversions 10154 Any success Total Successes 6778 under 65% Total Failures 3376 triggers the Success Rate 66.84% error analysis process. Average Time on Site 0:09:40 Visit Duration 0-10 seconds 2187 11-30 seconds 2132 31-60 seconds 798 61-180 seconds 1153 181-600 seconds 1343 601-1800 seconds 1587 1801+ seconds 954
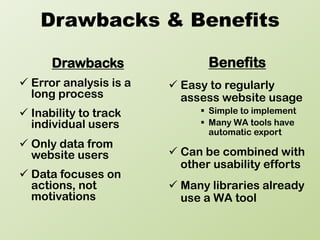
- 12. Drawbacks & Benefits Drawbacks Benefits ’ā╝ Error analysis is a ’ā╝ Easy to regularly long process assess website usage ’ā╝ Inability to track ’é¦ Simple to implement individual users ’é¦ Many WA tools have automatic export ’ā╝ Only data from website users ’ā╝ Can be combined with other usability efforts ’ā╝ Data focuses on actions, not ’ā╝ Many libraries already motivations use a WA tool
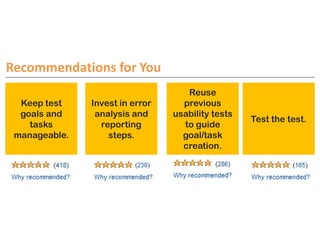
- 13. Recommendations for You Reuse Keep test Invest in error previous goals and analysis and usability tests Test the test. tasks reporting to guide manageable. steps. goal/task creation.
- 14. Summary ŌĆó Apply the structure of usability testing to your website use data ŌĆó Make your tasks measurable using website use data ŌĆó Be prepared to report the data regularly ŌĆó Error analysis is an essential process ŌĆó Make changes based on the data and test again!
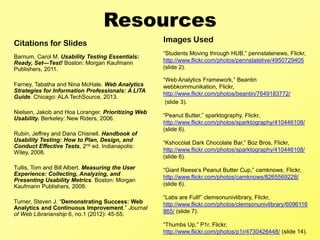
- 15. Resources Citations for ║▌║▌▀Żs Images Used ŌĆ£Students Moving through HUB,ŌĆØ pennstatenews, Flickr, Barnum, Carol M. Usability Testing Essentials: Ready, SetŌĆöTest! Boston: Morgan Kaufmann http://www.flickr.com/photos/pennstatelive/4950729405 Publishers, 2011. (slide 2). ŌĆ£Web Analytics Framework,ŌĆØ Beantin Farney, Tabatha and Nina McHale. Web Analytics webbkommunikation, Flickr, Strategies for Information Professionals: A LITA http://www.flickr.com/photos/beantin/7649183772/ Guide. Chicago: ALA TechSource, 2013. (slide 3). Nielsen, Jakob and Hoa Loranger. Prioritizing Web ŌĆ£Peanut Butter,ŌĆØ sparktography, Flickr, Usability. Berkeley: New Riders, 2006. http://www.flickr.com/photos/sparktography/410446108/ (slide 6). Rubin, Jeffrey and Dana Chisnell. Handbook of Usability Testing: How to Plan, Design, and ŌĆ£Kshocolat Dark Chocolate Bar,ŌĆØ Boz Bros, Flickr, Conduct Effective Tests, 2nd ed. Indianapolis: Wiley, 2008. http://www.flickr.com/photos/sparktography/410446108/ (slide 6). Tullis, Tom and Bill Albert. Measuring the User ŌĆ£Giant ReeseŌĆÖs Peanut Butter Cup,ŌĆØ camknows, Flickr, Experience: Collecting, Analyzing, and http://www.flickr.com/photos/camknows/8265569228/ Presenting Usability Metrics. Boston: Morgan Kaufmann Publishers, 2008. (slide 6). ŌĆ£Labs are Full!ŌĆØ clemsonunivlibrary, Flickr, Turner, Steven J. ŌĆ£Demonstrating Success: Web http://www.flickr.com/photos/clemsonunivlibrary/6096116 Analytics and Continuous Improvement.ŌĆØ Journal 865/ (slide 7). of Web Librarianship 6, no.1 (2012): 45-55. ŌĆ£Thumbs Up,ŌĆØ P1r, Flickr, http://www.flickr.com/photos/p1r/4730426448/ (slide 14).