際際滷

際際滷Share a Scribd company logo
USA EXPORTS TO INDIA OVERVIEW - ANALYSIS - JANUARY 2015
http://usimports.info/sales@usimports.info|+919331707877|India
息US Imports.Info
Analysis by Mita Mehta
Graphical Analysis of Exports from United States Of America (USA) to India in January 2015
Top 10 Chapters Value($USD) Chapter Description
71 271 Million Natural or cultured pearls, precious or semi-precious stones, precious metals, metals clad with precious metal, and articles thereof; imitation jewellery; coin
84 230 Million Nuclear reactors, boilers, machinery and mechanical appliance; parts thereof
27 128 Million Mineral Fuels, Mineral Oils and Products of their Distillation; Bituminous Substances; Mineral Waxes
90 108 Million Optical, Photographic, Cinematographic, measuring, checking, precision, medical or surgical instruments and apparatus; parts and accessories thereof
85 103 Million Electrical machinery and equipment and parts thereof; sound recorders and reproducers, television image and sound recorders and reproducers and parts and accessories of such articles
39 68 Million Plastics and articles thereof
29 62 Million Organic Chemicals
38 62 Million Miscellaneous Chemical Products
88 57 Million Aircraft, Spacecraft and parts thereof
08 52 Million Edible Fruit and Nuts; Peel of Citrus Fruit or Melons
Others 435 Million
Grand Total 1576 Million
American Emports to India is carried on almost all chapters. But more then 72% of the good are exported under top 10 Chapters.
USA is one of the top suppliers to India. In January 2015 Goods worth 1576 Million USD were Exported from USA which amounts to 6% of total
imports in India. In January USA ranked second only to China in supply of goods to India. Saudi Arabia became a close third.
71
17%
84
15%
27
8%
90
7%85
6%
39
4%
29
4%
38
4%
88
4%
08
3%
Others
28%
SHARE OF TOP 10 CHAPTERS
2
http://usimports.info |sales@usimports.info|+919331707877|India
息US Imports.Info
Graphical Analysis of Exports from United States Of America (USA) to India in January 2015
Next 20 Chapters Value($USD) Chapter Description
22 46 Million Beverages, Spirits and Vinegar
72 36 Million Iron and Steel
47 34 Million Pulp of wood or of other fibrous cellulosic material; recovered (waste and scrap) of paper or paperboard
28 32 Million Inorganic Chemicals; Organic or Inorganic Compounds of Precious Metals, of Rare-Earth Metals, of Radioactive Elements or of Isotopes
31 25 Million Fertilisers
73 21 Million Articles of Iron or Steel
40 18 Million Rubber and Articles thereof
48 16 Million Paper and paperboard; articles of Paper pulp, of paper or of paperboard
30 16 Million Pharmaceutical Products
87 16 Million Vehicles other than railway or tramway rolling stock, and parts and accessories thereof
76 14 Million Aluminium and Articles thereof
69 13 Million Ceramic Products
32 11 Million Tanning or Dyeing Extracts; Tannins and their Derivatives; Dyes, Pigments and Other Colouring Matter; Paints and Varnishes; Putty and other Mastics; Inks
49 11 Million Printed books, Newspapers, Pictures and other products of the printing industry; Manuscripts, Typescripts and Plans
98 9 Million Project Imports; Laboratory Chemicals; Passengers; Baggage; Personal importation''s by Air or Post; Ship Stores
07 9 Million Edible Vegetables and Certain Roots and Tubers
70 9 Million Glass and Glassware
86 7 Million Railway or tramway locomotives, rolling-stock and parts thereof; rail-way or tramway track fixtures and fittingsand parts thereof; mechanical (including electro-mechanical)traffic signalling equipment of all kinds
37 7 Million Photographic or Cinematographic Goods
Other 62 Chapters 79 Million
Grand Total 435 Million
Soap,Organic Surface-Active Agents,Washing Preparations,LubricatingPreparations, Artificial Waxes,Prepared WaxesPolishing or Scouring Preparations, Candles and similar Articles,
modelling Pastes, "Dental Waxes" and Dental Preparations with Basis of Plaster
34 7 Million
The next 20 Chapters cover another 18% of Import from USA. The last 10% is distributed over another 62 chapters.
22
11%
72
8%
47
8%
28
7%
31
6%
73
5%
40
4%
48
4%
30
4%
87
4%
76
3%69
3%32
3%
49
3%
98
2%
07
2%
70
2%
86
2%
37
2%
34
2%
Other 62 Chapters
18%
SHARE OF NEXT 20 CHAPTERS
3
http://usimports.info |sales@usimports.info|+919331707877|India
息US Imports.Info
Graphical Analysis of Exports from United States Of America (USA) to India in January 2015
Indian State Value(USD) of Import
Andhra Pradesh 70 Million
Chhattisgarh 0 Million
Delhi 352 Million
Goa 4 Million
Gujarat 236 Million
Haryana 20 Million
Karnataka 116 Million
Kerala 13 Million
Madhya Pradesh 1 Million
Maharashtra 508 Million
Pondicheri 5 Million
Punjab 14 Million
Rajasthan 2 Million
Tamil Nadu 155 Million
Uttar Pradesh 25 Million
West Bengal 55 Million
Grand Total 1576 Million
Ports Value($USD) % Share
Delhi Air 312 Million 20%
JNPT Sea 234 Million 15%
Mumbai Air 227 Million 14%
Mundra Sea 99 Million 6%
Bangalore Air 94 Million 6%
Chennai Sea 91 Million 6%
Kandla Sea 63 Million 4%
Chennai Air 47 Million 3%
Kolkata Sea 44 Million 3%
Mumbai Sea 37 Million 2%
Others 329 Million 21%
Grand Total 1576 Million 100%
Maharashtra is the highest importer of goods from USA.
The ports via which goods land here are JNPT Sea, Mumbai Air, Mumbai Sea, Mulund ICD, Nagpur ICD, Nashik-Janori ICD, Maliwada ICD, Bhusaval ICD, Pune-Talegoan ICD and Chinchwad ICD.
20% of import from USA is done in the capital of India
US supplied goods via 64 ports of India. But the top 10 ports had almost 80% of the pie.
312 Million
234 Million
227 Million
99 Million
94 Million
91 Million
63 Million
47 Million
44 Million
37 Million
329 Million
0 Million
50 Million
100 Million
150 Million
200 Million
250 Million
300 Million
350 Million
Delhi Air JNPT Sea Mumbai AirMundra Sea Bangalore
Air
Chennai
Sea
Kandla Sea Chennai Air Kolkata Sea Mumbai
Sea
Others
TOP 10 PORTS IMPORTING FROM USA
Andhra
Pradesh
4%
Chhattisgarh
0%
Delhi
22%
Goa
0%
Gujarat
15%
Haryana
1%
Karnataka
7%
Kerala
1%
Madhya Pradesh
0%
Maharashtra
32%
Pondicheri
0%
Punjab
1%
Rajasthan
0%
Tamil Nadu
10%
Uttar Pradesh
2%
West Bengal
3%
Other
2%
Value($) of Import in different states of India
4
http://usimports.info |sales@usimports.info|+919331707877|India
息US Imports.Info
Graphical Analysis of Exports from United States Of America (USA) to India in January 2015
Ports Value($USD) % Share
Tughlakabad ICD 36 Million 2%
Amhedabad Air 35 Million 2%
Pipavav Sea 27 Million 2%
Hyderabad Air 23 Million 1%
Vizag Sea 21 Million 1%
Krishnapatnam Sea 14 Million 1%
Ludhiana ICD 14 Million 1%
Faridabad ICD 12 Million 1%
Bangalore ICD 12 Million 1%
Kolkata Air 11 Million 1%
Mangalore Sea 11 Million 1%
Cochin Sea 9 Million 1%
Ennore Sea 8 Million 1%
Mulund ICD 8 Million 1%
Tuticorin Sea 6 Million 0%
Hyderabad ICD 6 Million 0%
Dadri-ACPL CFS ICD 6 Million 0%
Garhi Harsaru - Gurgaon ICD6 Million 0%
Kakinada Sea 5 Million 0%
Dadri-CGML ICD 5 Million 0%
Others 54 Million 3%
Grand Total 329 Million 21%
Other ports to where exported goods are sent are
Loni ICD, Thar Dry Port ICD, Sabarmati ICD, Karaikal Sea, Dadri - STTPL ICD, Patparganj ICD, Cochin Air, Goa Sea,
Baroda ICD, Kanakpura - Jaipur ICD, Patli ICD, Tuticorin ICD, Noida-Dadri ICD, Panki ICD, Nagpur ICD, Pithampur ICD,
Pakwara ICD, Dabolim Air, Trivendrun Air, Kanpur - JRY ICD, Vapi ICD, Nashik-Janori ICD, Raipur ICD, Rewari ICD,
Maliwada ICD, Bhusaval ICD, Pune-Talegoan ICD, Ankleshwar ICD, Chinchwad ICD, Coimbatore Air, Rajasansi Air,
Bhagat ki Kothi - Jodhpur ICD, Jaipur Air, Mandideep ICD
Almost 17.5 % went to the this 20 ports. A mere 2.5% of imports is distributed among the other 34 ports.
0 Million
10 Million
20 Million
30 Million
40 Million
50 Million
60 Million
Distribution of 17.5% of import among 20 ports
Tughlakabad ICD Amhedabad Air Pipavav Sea Hyderabad Air
Vizag Sea Krishnapatnam Sea Ludhiana ICD Faridabad ICD
Bangalore ICD Kolkata Air Mangalore Sea Cochin Sea
Ennore Sea Mulund ICD Tuticorin Sea Hyderabad ICD
Dadri-ACPL CFS ICD Garhi Harsaru - Gurgaon ICD Kakinada Sea Dadri-CGML ICD
Others
5
http://usimports.info |sales@usimports.info|+919331707877|India
息US Imports.Info
Graphical Analysis of Exports from United States Of America (USA) to India in January 2015
Mode of Import Value($USD)
Air 755 Million
Sea 145 Million
ICD 677 Million
Grand Total 1576 Million
Top 10 Chapters Air Sea ICD Grand Total
71 271 Million 25274 39634 271 Million Natural or cultured pearls, precious or semi-precious stones, precious metals, metals clad with precious metal, and articles thereof; imitation jewellery; coin
84 138 Million 87 Million 5 Million 230 Million Nuclear reactors, boilers, machinery and mechanical appliance; parts thereof
27 0 Million 128 Million 219822 128 Million Mineral Fuels, Mineral Oils and Products of their Distillation; Bituminous Substances; Mineral Waxes
90 96 Million 9 Million 2 Million 108 Million Optical, Photographic, Cinematographic, measuring, checking, precision, medical or surgical instruments and apparatus; parts and accessories thereof
39 8 Million 43 Million 16 Million 68 Million Plastics and articles thereof
29 5 Million 56 Million 1 Million 62 Million Organic Chemicals
38 24 Million 30 Million 9 Million 62 Million Miscellaneous Chemical Products
88 57 Million 70692 57 Million Aircraft, Spacecraft and parts thereof
08 4402 27 Million 25 Million 52 Million Edible Fruit and Nuts; Peel of Citrus Fruit or Melons
Grand Total 679 Million 396 Million 67 Million 1141 Million
Distribution of top 10 Chapters via mode of transport
Electrical machinery and equipment and parts thereof; sound recorders and reproducers, television image and sound recorders and reproducers and
parts and accessories of such articles103 Million7 Million17 Million79 Million85
From USA more than 48% of goods are airlifted to India. Rest are sent via sea course.
755 Million
145 Million
677 Million
0 Million
100 Million
200 Million
300 Million
400 Million
500 Million
600 Million
700 Million
800 Million
Air Sea ICD
SUM OF VALUE(INR)
6
http://usimports.info |sales@usimports.info|+919331707877|India
息US Imports.Info
Graphical Analysis of Exports from United States Of America (USA) to India in January 2015
Top 10 Chapters Value($USD) Chapter Description
71 271 Million Natural or cultured pearls, precious or semi-precious stones, precious metals, metals clad with precious metal, and articles thereof; imitation jewellery; coin
84 138 Million Nuclear reactors, boilers, machinery and mechanical appliance; parts thereof
90 96 Million Optical, Photographic, Cinematographic, measuring, checking, precision, medical or surgical instruments and apparatus; parts and accessories thereof
85 79 Million Electrical machinery and equipment and parts thereof; sound recorders and reproducers, television image and sound recorders and reproducers and parts and accessories of such articles
88 57 Million Aircraft, Spacecraft and parts thereof
38 24 Million Miscellaneous Chemical Products
30 15 Million Pharmaceutical Products
39 8 Million Plastics and articles thereof
73 7 Million Articles of Iron or Steel
49 7 Million Printed books, Newspapers, Pictures and other products of the printing industry; Manuscripts, Typescripts and Plans
Grand Total 704 Million
Top 10 Chapters Value($USD) Chapter Description
27 128 Million Mineral Fuels, Mineral Oils and Products of their Distillation; Bituminous Substances; Mineral Waxes
84 87 Million Nuclear reactors, boilers, machinery and mechanical appliance; parts thereof
29 56 Million Organic Chemicals
22 46 Million Beverages, Spirits and Vinegar
39 43 Million Plastics and articles thereof
38 30 Million Miscellaneous Chemical Products
08 27 Million Edible Fruit and Nuts; Peel of Citrus Fruit or Melons
28 26 Million Inorganic Chemicals; Organic or Inorganic Compounds of Precious Metals, of Rare-Earth Metals, of Radioactive Elements or of Isotopes
31 25 Million Fertilisers
72 21 Million Iron and Steel
Grand Total 487 Million
Air - Top 10 chapters that contributes to almost 93% Air Import from USA
Sea - Distribution of 72% of Sea imports is in the top 10 chapters.
271 Million
138 Million
96 Million
79 Million
57 Million
24 Million
15 Million
8 Million
7 Million
7 Million
Via Air Import of top 10 chapters
49
73
39
30
38
88
85
90
84
71
128 Million
87 Million
56 Million
46 Million
43 Million
30 Million
27 Million
26 Million
25 Million
21 Million
Via Sea Import of top 10 chapters
72
31
28
08
38
39
22
29
84
27
7
http://usimports.info |sales@usimports.info|+919331707877|India
息US Imports.Info
Graphical Analysis of Exports from United States Of America (USA) to India in January 2015
Top 10 Chapters Value($USD) Chapter Description
08 25 Million Edible Fruit and Nuts; Peel of Citrus Fruit or Melons
39 16 Million Plastics and articles thereof
72 15 Million Iron and Steel
47 14 Million Pulp of wood or of other fibrous cellulosic material; recovered (waste and scrap) of paper or paperboard
76 10 Million Aluminium and Articles thereof
38 9 Million Miscellaneous Chemical Products
48 8 Million Paper and paperboard; articles of Paper pulp, of paper or of paperboard
85 7 Million Electrical machinery and equipment and parts thereof; sound recorders and reproducers, television image and sound recorders and reproducers and parts and accessories of such articles
84 5 Million Nuclear reactors, boilers, machinery and mechanical appliance; parts thereof
87 3 Million Vehicles other than railway or tramway rolling stock, and parts and accessories thereof
Grand Total 112 Million
ICD - 72% of ICD clearance is for this 10 chapters with almost 17% for Chapter 8
25 Million
16 Million
15 Million
14 Million
10 Million
9 Million
8 Million
7 Million
5 Million
3 Million
0 Million 5 Million 10 Million 15 Million 20 Million 25 Million 30 Million
Via ICD Clearance of top 10 chapters
87
84
85
48
38
76
47
72
39
08
8
http://usimports.info |sales@usimports.info|+919331707877|India
息US Imports.Info
Graphical Analysis of Exports from United States Of America (USA) to India in January 2015
Ports Value($USD)
Amhedabad Air 30 Million
Bangalore Air 343327
Chennai Air 126470
Delhi Air 201 Million
Hyderabad Air 495
JNPT Sea 25274
Kolkata Air 1868
Mumbai Air 40 Million
Patparganj ICD 39634
Trivendrun Air 3256
Grand Total 271 Million
HS Code Value($USD) % Share
71081200 266 Million 98% Gold (including gold plated with platinum) unwrought or in semi-manufactured forms, or in powder for Other Non-Monetary: unwrought forms
71102900 2 Million 1% Platinum, unwrought or in semi- manufactured form, or in powder form - Platinum: Other - Rhodium :
71101120 1 Million 1% Platinum, unwrought or in semi- manufactured form, or in powder form - Platinum: In powder form
71102100 522828 0% Platinum, unwrought or in semi- manufactured form, or in powder form - Platinum: Unwrought or in powder form
71103900 230556 0% Platinum, unwrought or in semi- manufactured form, or in powder form - Platinum: Other - Iridium, osmium and ruthenium:
71069290 214200 0% Silver (including silver plated with gold or platinum), unwrought or in semi-manufactured forms, or in powder form Other
71069210 183458 0% Silver (including silver plated with gold or platinum), unwrought or in semi-manufactured forms, or in powder form Sheets, plates, strips, tubes and pipes
71131910 95353 0% Articles of jewellery and parts thereof, of precious metal - Of metal clad with precious metal: Of gold, unstudded
71104100 62841 0% Platinum, unwrought or in semi- manufactured form, or in powder form - Platinum: Unwrought or in powder from
71051000 31724 0% Dust and powder of natural or synthetic precious or semi-precious stones Of diamonds
71131190 22175 0% Articles of jewellery and parts thereof, of precious metal - Of metal clad with precious metal: Parts
71104900 17314 0% Platinum, unwrought or in semi- manufactured form, or in powder form - Platinum: Other
71131940 15830 0% Articles of jewellery and parts thereof, of precious metal - Of metal clad with precious metal: Of gold, set with other precious and semi-precious stones
71031029 10678 0%
71059000 8932 0% Dust and powder of natural or synthetic precious or semi-precious stones Other
71049000 2836 0%
71141110 2662 0%
71159090 2150 0% Other articles of precious metal or of metal clad with precious metal Other
71031011 1347 0%
71159010 1075 0% Other articles of precious metal or of metal clad with precious metal Laboratory and industrial articles of precious metal
71101900 475 0% Platinum, unwrought or in semi- manufactured form, or in powder form - Platinum: Other - Palladium:
71162000 354 0% Articles of natural or cultured pearls, precious or semi-precious stones(natural, synthetic or reconstructed Of precious or semi-precious stones (natural, synthetic or reconstructed)
71131990 334 0% Articles of jewellery and parts thereof, of precious metal - Of metal clad with precious metal: Parts
71171990 294 0% Imitation Jewellery of base metal, whether or not placed with precious metal : - Of base metal, whether or not plated with precious metal: Other
71039990 274 0%
71081300 29 0% Gold (including gold plated with platinum) unwrought or i8n semi-manufactured forms, or in powder form - Non-monetary: Other semi- manufactured forms Monetary
Grand Total 271 Million 100%
Goods import under ch 71 where imported via 10 ports of India. Delhi Air having the share of almost 74%.
USA stands at second (13%) after Switzerland (25%) on import of goods under Ch 71.
Ch 71: Natural or cultured pearls, precious or semi-precious stones, precious metals, metals clad with precious metal, and articles thereof; imitation jewellery; coin
Almost 98% of import is carried out under hs code 71081200. Another 25 Hs codes contributes the rest 2%.
Precious stones (other than diamonds) and semi-precious stones, whether or not worked or graded but not strung, mounted or set; ungraded precious stones (other than diamonds) and
semi-precious stones, temporarily strung for convenience of transport Other - Otherwise worked :
Synthetic or reconstructed precious or semi-precious stones, whether or not worked or graded but not strung, mounted or set; ungraded synthetic or reconstructed precious stones,
temporarily strung for convenience of transport Other
Articles of goldsmiths or silversmiths wares and parts thereof, of precious metal or of metal clad with precious metal - Of precious metal, whether or not plated or clad with precious
metal: Articles
Precious stones (other than diamonds) and semi-precious stones, whether or not worked or graded but not strung, mounted or set; ungraded precious stones (other than diamonds) and
semi-precious stones, temporarily strung for convenience of transport Emerald
Precious stones (other than diamonds) and semi-precious stones, whether or not worked or graded but not strung, mounted or set; ungraded precious stones (other than diamonds) and
semi-precious stones, temporarily strung for convenience of transport Other
Amhedabad Air
11%
Bangalore Air
0%
Chennai
Air
0%
Delhi Air
74%
Hyderabad
Air
0%JNPT Sea
0%Kolkata Air
0%
Mumbai Air
15%
Patparganj ICD
0%
Trivendrun
Air
0%
PORTS WHERE GOODS UNDER CH 71 ARE IMPORTED
9
http://usimports.info |sales@usimports.info|+919331707877|India
息US Imports.Info
Graphical Analysis of Exports from United States Of America (USA) to India in January 2015
Ports Value($USD)
Bangalore Air 5605
Chennai Air 1612
Chennai Sea 239792
Cochin Sea 3 Million
Delhi Air 6316
Ennore Sea 8 Million
Faridabad ICD 81439
Garhi Harsaru - Gurgaon ICD 8395
Hyderabad Air 2157
JNPT Sea 5 Million
Kandla Sea 9 Million
Karaikal Sea 5 Million
Kolkata Air 254
Kolkata Sea 11 Million
Krishnapatnam Sea 11 Million
Mangalore Sea 10 Million
Mumbai Air 19558
Mumbai Sea 15 Million
Mundra Sea 24 Million
Patparganj ICD 25759
Pipavav Sea 9 Million
Tughlakabad ICD 104229
Tuticorin Sea 1 Million
Vizag Sea 17 Million
Grand Total 128 Million
Even though goods under ch 27 are the highest commodity imported from USA via Sea it contributes mere 2% of total Indian import under Ch 27.
Goods import under ch 27 are well distributed under 24 ports of India. Seaports of Mundra, Vizag and Mumbai have shown the highest quantity of import in Jan 15.
Chapter 27 - Mineral Fuels, Mineral Oils and Products of their Distillation; Bituminous Substances; Mineral Waxes
Bangalore Air
0%
Chennai Air
0%
Chennai Sea
0%
Cochin Sea
2%
Delhi Air
0%
Ennore Sea
6%
Faridabad ICD
0%
Garhi Harsaru
- Gurgaon ICD
0%
Hyderabad
Air
0% JNPT Sea
4%
Kandla Sea
7%
Karaikal Sea
4%
Kolkata Air
0%
Kolkata Sea
9%
Krishnapatnam Sea
9%
Mangalore Sea
8%
Mumbai Air
0%
Mumbai Sea
12%
Mundra Sea
19%
Patparganj
ICD
0%
Pipavav Sea
7%
Tughlakabad ICD
0%
Tuticorin Sea
1%
Vizag Sea
14%
PORT WISE SHARE OF IMPORT UNDER CH 27
10
http://usimports.info |sales@usimports.info|+919331707877|India
息US Imports.Info
Graphical Analysis of Exports from United States Of America (USA) to India in January 2015
HS Code Value($USD) % Share
27131100 48 Million 37% Petroleum coke: Not calcined
27011200 27 Million 21% Bituminous coal
27079900 24 Million 19% Harmonised Codes of Oils and other products of the distillation of high temperature coal tar, similar products in which Other
27101960 15 Million 12% Base oil
27011910 12 Million 9% Coking coal
27101980 1 Million 1% Lubricating oil
27129090 388377 0% Harmonised Codes of Petroleum jelly, paraffin wax, microcystalline petroleum wad, slack wax, ozokerite, lignite wax, pet: Other
27129010 206223 0% Micro-Crystalline Petroleum wax
27150090 156801 0% Bituminous mixtures based on natural asphalt, on natural bitumen, on petroleum bitumen, on mineral tar or on mineral tar pitch (for example, bituminous mastics, cut backs): Other
27101990 119412 0% Harmonised Codes of Petroleum oils and oils obtained from bituminous minerals, other than crude; preparations not elsewh: Other
27075000 71634 0% Other aromatic hydrocarbon mixtures of which 65% or more by volume (including losses) distils at 250 deg. cel. By the ASTM D86 method - Other:
27121090 69322 0% Petroleum jelly: Other
27101290 52372 0% Harmonised Codes of Petroleum oils and oils obtained from bituminous minerals, other than crude; preparations not elsewh: Motor Spirit: Other
27149030 48912 0% Gilsonete
27074000 44034 0% Naphthelene
27149010 40028 0% Asphalt natural
27122000 29212 0% Paraffin wax containing by weight less than 0.75 % of oil:
27129040 22398 0% Paraffin wax containing by weight 0.75 % or more of oil
27131200 19885 0% Calcined
27011100 6286 0% Anthracite
27060010 3606 0% Coal tar
27102000 1480 0%
27073000 1084 0% Xylole (xylenes)
27090000 882 0% Harmonised Codes Pitch: Petroleum oils and oils obtained from bituminous minerals, crude
27011920 282 0% Steam coal
27101920 63 0% Aviation turbine fuel(ATF)
27101950 19 0% Fuel oil
Grand Total 128 Million 100%
Petroleum oils and oils obtained from bituminous minerals (other than crude) and preparations not elsewhere specified or included, containing by weight 70% or more of petroleum oils or
of oils obtained from bituminous minerals, these oils being the basic constituents of the preparations, other than those containing biodiesel and other tham Waste oils:
Almost 98% of import is carried out under hs code five HS codes which are 27131100, 27011200, 27079900, 27101960 and 27011910.
Another 22 Hs codes contributes the rest 2%.
11
http://usimports.info |sales@usimports.info|+919331707877|India
息US Imports.Info
Graphical Analysis of Exports from United States Of America (USA) to India in January 2015
Port Value($USD)
Bangalore Air 4402
Chennai Sea 2 Million
Cochin Sea 137617
Dadri-ACPL CFS ICD 312720
Faridabad ICD 11 Million
JNPT Sea 25 Million
Kolkata Sea 73989
Krishnapatnam Sea 68364
Ludhiana ICD 5 Million
Mangalore Sea 136777
Nagpur ICD 421966
Tughlakabad ICD 8 Million
Tuticorin Sea 424662
Grand Total 52 Million
HS Code Value($USD) % Share
08021100 42 Million 82% Harmonised Codes of Other nuts, fresh or dried, whether or not shelled or peeled: Almonds: In shell
08081000 5 Million 9% Apples, pears and quinces, fresh Apples
08021200 2 Million 5% Harmonised Codes of Other nuts, fresh or dried, whether or not shelled or peeled: Almonds: Shelled - Hazelnuts or filberts (Corylus spp ):
08023100 1 Million 3% Harmonised Codes of Other nuts, fresh or dried, whether or not shelled or peeled: Walnuts: In shell
08083000 474360 1% Apples, pears and quinces, fresh Pears
08025100 348423 1% Harmonised Codes of Other nuts, fresh or dried, whether or not shelled or peeled: Harmonised Codes of Almonds: In shell
08061000 143817 0% Grapes, fresh or dried Fresh
08132000 34475 0% Fruit, dried, other than that of headings 08.01 to 08.06; mixtures of nuts or dried fruits of this Chapter Prunes
08029000 18292 0% Harmonised Codes of Other nuts, fresh or dried, whether or not shelled or peeled: Betel nuts: Areca nuts: Other Other
08104000 4402 0% Other fruit, fresh Cranberries, bilberries and other fruit of the genus Vaccinium
Grand Total 52 Million 100%
Chapter 8 - Edible Fruit and Nuts; Peel of Citrus Fruit or Melons
US stands at number one in export to India under Ch 8 at 38%. Tanzania comes second at 25%.
Goods import under ch 08 are distributed among 13 ports of India. Even though among the ICD it takes number one position, it's almost 47% of import is done via JNPT Sea.
82% of goods under Chapter 8 are imported under 08021100
Bangalore Air
0%
Chennai Sea
3%
Cochin Sea
0%
Dadri-ACPL CFS
ICD
1%
Faridabad ICD
22%
JNPT Sea
47%
Kolkata Sea
0%
Krishnapatnam
Sea
0%
Ludhiana ICD
10%
Mangalore Sea
0%
Nagpur ICD
1%
Tughlakabad ICD
15%
Tuticorin
Sea
1%
SUM OF VALUE(INR)
12
http://usimports.info |sales@usimports.info|+919331707877|India
息US Imports.Info
Graphical Analysis of Exports from United States Of America (USA) to India in January 2015
Thank you for viewing this analytical report.
Please note:
This analysis in accordance with India Trade Classification Harmonised Code.
Information is based on receipt of goods in India in Jan 2015 from USA
Further analysis and customisation is possible as per the requirement
TEAM US IMPORTS. INFO
Copyright: All material on these pages, including without limitation text, logos, icons, photographs and all other artwork, is copyright material of Mahavir Law House, unless
otherwise stated. Use may be made of these pages for non-commercial purposes without permission from the copyright holder. Commercial use of this material may only be made
with the express, prior, written permission of Mahavir Law House.
Disclaimer: Mahavir Law House seeks to ensure that information contained in these pages is accurate. However, no liability, or responsibility is accepted arising from reliance upon
the information contained in these pages.
13
http://usimports.info |sales@usimports.info|+919331707877|India
息US Imports.Info
Ad

Recommended

Imports from china to india
Mita Mehta
Organic chemicals import march 29
Mita Mehta
Exports from india scheme
Machiraju Presentations Pvt. Ltd.
Plastic Imports in India july 14
Mita Mehta
iNDO CHINA TRADE RELATION REPORT
Via逃h umar
Rubber imports In India during july 14
Mita Mehta
SARS Media Release
SARS Media Release
SABC News
Gujarat
Gujarat
FNian
Indo-Central Asian Trade.ppt The Importance of Trade Routes.
dsen68
Gujarat
Gujarat
niratshah
Sqm corp pres q3_final
Sociedad_Quimica_Miniera
#Know What India Exports# By SN Panigrahi
SN Panigrahi, PMP
Global Energy Outlook by Carlos Pascual, Special Envoy and Coordinator for In...
atlanticcouncil
Export Products of Kazakhstan 2016
Embassy of Kazakhstan in the USA
South west
South west
subin sabu
Gujarat.ppt
Gujarat.ppt
JapLang
Study on Sourcing Opportunities in Russia
John William
Bangladesh national budget analysis 2019-20
Nayanaviram Nayan
S4F03 Col11 Conversion of Accounting to SAP S/4HANA
Libreria ERP
Electronic Shelf Labels & Digital Price Tags in Delhi | Foodcare
Foodcare llp
BOURNS POTENTIOMETER Provide You Precision
smidmart
SF Welly User Group_Xero_Building Better Agents.pdf
Raksha Meanger
Order to Show Cause, Show Notice to Employee
SeemaAgrawal43
Marketing Assignment presentation of good marketing techniques how to impleme...
Priya Raj
AX to Dynamics 365 Finance and Operations in USA.pdf
Trident information system
Glow Up Your Desk: The MOOJAY Monitor Stand Experience
Topmate
Ian McAllister - Respected Photographer And Writer
Ian McAllister
Paul Turovsky - A Key Contributor
Paul Turovsky
Ihor Pavlenko: 丕仗舒于仍仆仆 亳亰亳从舒仄亳 亰舒 亟仂仗仂仄仂亞仂 AI (UA)
Lviv Startup Club
Tesia Dobrydnia - A Leader In Her Industry
Tesia Dobrydnia

More Related Content

Similar to USA Exports to India Overview (10)

Indo-Central Asian Trade.ppt The Importance of Trade Routes.
dsen68
Gujarat
Gujarat
niratshah
Sqm corp pres q3_final
Sociedad_Quimica_Miniera
#Know What India Exports# By SN Panigrahi
SN Panigrahi, PMP
Global Energy Outlook by Carlos Pascual, Special Envoy and Coordinator for In...
atlanticcouncil
Export Products of Kazakhstan 2016
Embassy of Kazakhstan in the USA
South west
South west
subin sabu
Gujarat.ppt
Gujarat.ppt
JapLang
Study on Sourcing Opportunities in Russia
John William
Bangladesh national budget analysis 2019-20
Nayanaviram Nayan
Indo-Central Asian Trade.ppt The Importance of Trade Routes.
dsen68
#Know What India Exports# By SN Panigrahi
SN Panigrahi, PMP
Global Energy Outlook by Carlos Pascual, Special Envoy and Coordinator for In...
atlanticcouncil
Gujarat.ppt
Gujarat.ppt
JapLang
Study on Sourcing Opportunities in Russia
John William
Bangladesh national budget analysis 2019-20
Nayanaviram Nayan

Recently uploaded (20)

S4F03 Col11 Conversion of Accounting to SAP S/4HANA
Libreria ERP
Electronic Shelf Labels & Digital Price Tags in Delhi | Foodcare
Foodcare llp
BOURNS POTENTIOMETER Provide You Precision
smidmart
SF Welly User Group_Xero_Building Better Agents.pdf
Raksha Meanger
Order to Show Cause, Show Notice to Employee
SeemaAgrawal43
Marketing Assignment presentation of good marketing techniques how to impleme...
Priya Raj
AX to Dynamics 365 Finance and Operations in USA.pdf
Trident information system
Glow Up Your Desk: The MOOJAY Monitor Stand Experience
Topmate
Ian McAllister - Respected Photographer And Writer
Ian McAllister
Paul Turovsky - A Key Contributor
Paul Turovsky
Ihor Pavlenko: 丕仗舒于仍仆仆 亳亰亳从舒仄亳 亰舒 亟仂仗仂仄仂亞仂 AI (UA)
Lviv Startup Club
Tesia Dobrydnia - A Leader In Her Industry
Tesia Dobrydnia
Power of the Many: Digital Energy Masterclass
mariana491193
Stone Hill Ready Mix Concrete Bagalur
stonehillrealtyblr
IT Companies in Magarpatta: A Thriving Hub of Technology and Innovation
prernarathi90
S4F02 Col11 Management Accounting in SAP S/4HANA for SAP ERP CO Professionals
Libreria ERP
Power of the Many Masterclasses - 2nd draft .pptx
AlexBausch2
Company Profile [Popular Group of Industries]
irtizashirazi
Methyl Iodides Vital Role in Pharma and Agrochemicals
ChemicalsChem Blogs
The APCO Geopolitical Radar Q3 2025 Edition
APCO
Ad

USA Exports to India Overview

  • 1. USA EXPORTS TO INDIA OVERVIEW - ANALYSIS - JANUARY 2015 http://usimports.info/sales@usimports.info|+919331707877|India 息US Imports.Info Analysis by Mita Mehta
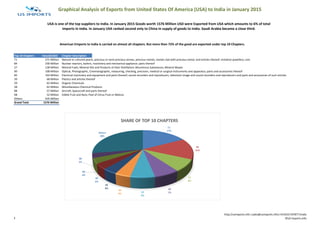
  • 2. Graphical Analysis of Exports from United States Of America (USA) to India in January 2015 Top 10 Chapters Value($USD) Chapter Description 71 271 Million Natural or cultured pearls, precious or semi-precious stones, precious metals, metals clad with precious metal, and articles thereof; imitation jewellery; coin 84 230 Million Nuclear reactors, boilers, machinery and mechanical appliance; parts thereof 27 128 Million Mineral Fuels, Mineral Oils and Products of their Distillation; Bituminous Substances; Mineral Waxes 90 108 Million Optical, Photographic, Cinematographic, measuring, checking, precision, medical or surgical instruments and apparatus; parts and accessories thereof 85 103 Million Electrical machinery and equipment and parts thereof; sound recorders and reproducers, television image and sound recorders and reproducers and parts and accessories of such articles 39 68 Million Plastics and articles thereof 29 62 Million Organic Chemicals 38 62 Million Miscellaneous Chemical Products 88 57 Million Aircraft, Spacecraft and parts thereof 08 52 Million Edible Fruit and Nuts; Peel of Citrus Fruit or Melons Others 435 Million Grand Total 1576 Million American Emports to India is carried on almost all chapters. But more then 72% of the good are exported under top 10 Chapters. USA is one of the top suppliers to India. In January 2015 Goods worth 1576 Million USD were Exported from USA which amounts to 6% of total imports in India. In January USA ranked second only to China in supply of goods to India. Saudi Arabia became a close third. 71 17% 84 15% 27 8% 90 7%85 6% 39 4% 29 4% 38 4% 88 4% 08 3% Others 28% SHARE OF TOP 10 CHAPTERS 2 http://usimports.info |sales@usimports.info|+919331707877|India 息US Imports.Info
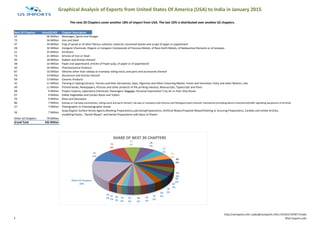
  • 3. Graphical Analysis of Exports from United States Of America (USA) to India in January 2015 Next 20 Chapters Value($USD) Chapter Description 22 46 Million Beverages, Spirits and Vinegar 72 36 Million Iron and Steel 47 34 Million Pulp of wood or of other fibrous cellulosic material; recovered (waste and scrap) of paper or paperboard 28 32 Million Inorganic Chemicals; Organic or Inorganic Compounds of Precious Metals, of Rare-Earth Metals, of Radioactive Elements or of Isotopes 31 25 Million Fertilisers 73 21 Million Articles of Iron or Steel 40 18 Million Rubber and Articles thereof 48 16 Million Paper and paperboard; articles of Paper pulp, of paper or of paperboard 30 16 Million Pharmaceutical Products 87 16 Million Vehicles other than railway or tramway rolling stock, and parts and accessories thereof 76 14 Million Aluminium and Articles thereof 69 13 Million Ceramic Products 32 11 Million Tanning or Dyeing Extracts; Tannins and their Derivatives; Dyes, Pigments and Other Colouring Matter; Paints and Varnishes; Putty and other Mastics; Inks 49 11 Million Printed books, Newspapers, Pictures and other products of the printing industry; Manuscripts, Typescripts and Plans 98 9 Million Project Imports; Laboratory Chemicals; Passengers; Baggage; Personal importation''s by Air or Post; Ship Stores 07 9 Million Edible Vegetables and Certain Roots and Tubers 70 9 Million Glass and Glassware 86 7 Million Railway or tramway locomotives, rolling-stock and parts thereof; rail-way or tramway track fixtures and fittingsand parts thereof; mechanical (including electro-mechanical)traffic signalling equipment of all kinds 37 7 Million Photographic or Cinematographic Goods Other 62 Chapters 79 Million Grand Total 435 Million Soap,Organic Surface-Active Agents,Washing Preparations,LubricatingPreparations, Artificial Waxes,Prepared WaxesPolishing or Scouring Preparations, Candles and similar Articles, modelling Pastes, "Dental Waxes" and Dental Preparations with Basis of Plaster 34 7 Million The next 20 Chapters cover another 18% of Import from USA. The last 10% is distributed over another 62 chapters. 22 11% 72 8% 47 8% 28 7% 31 6% 73 5% 40 4% 48 4% 30 4% 87 4% 76 3%69 3%32 3% 49 3% 98 2% 07 2% 70 2% 86 2% 37 2% 34 2% Other 62 Chapters 18% SHARE OF NEXT 20 CHAPTERS 3 http://usimports.info |sales@usimports.info|+919331707877|India 息US Imports.Info
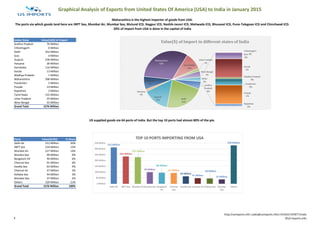
  • 4. Graphical Analysis of Exports from United States Of America (USA) to India in January 2015 Indian State Value(USD) of Import Andhra Pradesh 70 Million Chhattisgarh 0 Million Delhi 352 Million Goa 4 Million Gujarat 236 Million Haryana 20 Million Karnataka 116 Million Kerala 13 Million Madhya Pradesh 1 Million Maharashtra 508 Million Pondicheri 5 Million Punjab 14 Million Rajasthan 2 Million Tamil Nadu 155 Million Uttar Pradesh 25 Million West Bengal 55 Million Grand Total 1576 Million Ports Value($USD) % Share Delhi Air 312 Million 20% JNPT Sea 234 Million 15% Mumbai Air 227 Million 14% Mundra Sea 99 Million 6% Bangalore Air 94 Million 6% Chennai Sea 91 Million 6% Kandla Sea 63 Million 4% Chennai Air 47 Million 3% Kolkata Sea 44 Million 3% Mumbai Sea 37 Million 2% Others 329 Million 21% Grand Total 1576 Million 100% Maharashtra is the highest importer of goods from USA. The ports via which goods land here are JNPT Sea, Mumbai Air, Mumbai Sea, Mulund ICD, Nagpur ICD, Nashik-Janori ICD, Maliwada ICD, Bhusaval ICD, Pune-Talegoan ICD and Chinchwad ICD. 20% of import from USA is done in the capital of India US supplied goods via 64 ports of India. But the top 10 ports had almost 80% of the pie. 312 Million 234 Million 227 Million 99 Million 94 Million 91 Million 63 Million 47 Million 44 Million 37 Million 329 Million 0 Million 50 Million 100 Million 150 Million 200 Million 250 Million 300 Million 350 Million Delhi Air JNPT Sea Mumbai AirMundra Sea Bangalore Air Chennai Sea Kandla Sea Chennai Air Kolkata Sea Mumbai Sea Others TOP 10 PORTS IMPORTING FROM USA Andhra Pradesh 4% Chhattisgarh 0% Delhi 22% Goa 0% Gujarat 15% Haryana 1% Karnataka 7% Kerala 1% Madhya Pradesh 0% Maharashtra 32% Pondicheri 0% Punjab 1% Rajasthan 0% Tamil Nadu 10% Uttar Pradesh 2% West Bengal 3% Other 2% Value($) of Import in different states of India 4 http://usimports.info |sales@usimports.info|+919331707877|India 息US Imports.Info
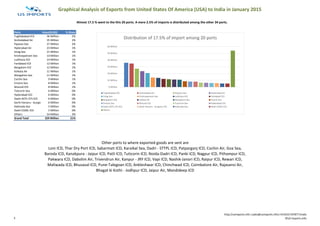
  • 5. Graphical Analysis of Exports from United States Of America (USA) to India in January 2015 Ports Value($USD) % Share Tughlakabad ICD 36 Million 2% Amhedabad Air 35 Million 2% Pipavav Sea 27 Million 2% Hyderabad Air 23 Million 1% Vizag Sea 21 Million 1% Krishnapatnam Sea 14 Million 1% Ludhiana ICD 14 Million 1% Faridabad ICD 12 Million 1% Bangalore ICD 12 Million 1% Kolkata Air 11 Million 1% Mangalore Sea 11 Million 1% Cochin Sea 9 Million 1% Ennore Sea 8 Million 1% Mulund ICD 8 Million 1% Tuticorin Sea 6 Million 0% Hyderabad ICD 6 Million 0% Dadri-ACPL CFS ICD 6 Million 0% Garhi Harsaru - Gurgaon ICD6 Million 0% Kakinada Sea 5 Million 0% Dadri-CGML ICD 5 Million 0% Others 54 Million 3% Grand Total 329 Million 21% Other ports to where exported goods are sent are Loni ICD, Thar Dry Port ICD, Sabarmati ICD, Karaikal Sea, Dadri - STTPL ICD, Patparganj ICD, Cochin Air, Goa Sea, Baroda ICD, Kanakpura - Jaipur ICD, Patli ICD, Tuticorin ICD, Noida-Dadri ICD, Panki ICD, Nagpur ICD, Pithampur ICD, Pakwara ICD, Dabolim Air, Trivendrun Air, Kanpur - JRY ICD, Vapi ICD, Nashik-Janori ICD, Raipur ICD, Rewari ICD, Maliwada ICD, Bhusaval ICD, Pune-Talegoan ICD, Ankleshwar ICD, Chinchwad ICD, Coimbatore Air, Rajasansi Air, Bhagat ki Kothi - Jodhpur ICD, Jaipur Air, Mandideep ICD Almost 17.5 % went to the this 20 ports. A mere 2.5% of imports is distributed among the other 34 ports. 0 Million 10 Million 20 Million 30 Million 40 Million 50 Million 60 Million Distribution of 17.5% of import among 20 ports Tughlakabad ICD Amhedabad Air Pipavav Sea Hyderabad Air Vizag Sea Krishnapatnam Sea Ludhiana ICD Faridabad ICD Bangalore ICD Kolkata Air Mangalore Sea Cochin Sea Ennore Sea Mulund ICD Tuticorin Sea Hyderabad ICD Dadri-ACPL CFS ICD Garhi Harsaru - Gurgaon ICD Kakinada Sea Dadri-CGML ICD Others 5 http://usimports.info |sales@usimports.info|+919331707877|India 息US Imports.Info
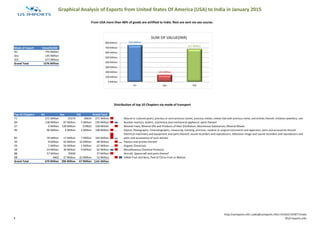
  • 6. Graphical Analysis of Exports from United States Of America (USA) to India in January 2015 Mode of Import Value($USD) Air 755 Million Sea 145 Million ICD 677 Million Grand Total 1576 Million Top 10 Chapters Air Sea ICD Grand Total 71 271 Million 25274 39634 271 Million Natural or cultured pearls, precious or semi-precious stones, precious metals, metals clad with precious metal, and articles thereof; imitation jewellery; coin 84 138 Million 87 Million 5 Million 230 Million Nuclear reactors, boilers, machinery and mechanical appliance; parts thereof 27 0 Million 128 Million 219822 128 Million Mineral Fuels, Mineral Oils and Products of their Distillation; Bituminous Substances; Mineral Waxes 90 96 Million 9 Million 2 Million 108 Million Optical, Photographic, Cinematographic, measuring, checking, precision, medical or surgical instruments and apparatus; parts and accessories thereof 39 8 Million 43 Million 16 Million 68 Million Plastics and articles thereof 29 5 Million 56 Million 1 Million 62 Million Organic Chemicals 38 24 Million 30 Million 9 Million 62 Million Miscellaneous Chemical Products 88 57 Million 70692 57 Million Aircraft, Spacecraft and parts thereof 08 4402 27 Million 25 Million 52 Million Edible Fruit and Nuts; Peel of Citrus Fruit or Melons Grand Total 679 Million 396 Million 67 Million 1141 Million Distribution of top 10 Chapters via mode of transport Electrical machinery and equipment and parts thereof; sound recorders and reproducers, television image and sound recorders and reproducers and parts and accessories of such articles103 Million7 Million17 Million79 Million85 From USA more than 48% of goods are airlifted to India. Rest are sent via sea course. 755 Million 145 Million 677 Million 0 Million 100 Million 200 Million 300 Million 400 Million 500 Million 600 Million 700 Million 800 Million Air Sea ICD SUM OF VALUE(INR) 6 http://usimports.info |sales@usimports.info|+919331707877|India 息US Imports.Info
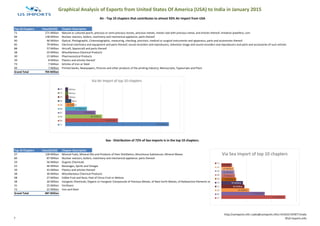
  • 7. Graphical Analysis of Exports from United States Of America (USA) to India in January 2015 Top 10 Chapters Value($USD) Chapter Description 71 271 Million Natural or cultured pearls, precious or semi-precious stones, precious metals, metals clad with precious metal, and articles thereof; imitation jewellery; coin 84 138 Million Nuclear reactors, boilers, machinery and mechanical appliance; parts thereof 90 96 Million Optical, Photographic, Cinematographic, measuring, checking, precision, medical or surgical instruments and apparatus; parts and accessories thereof 85 79 Million Electrical machinery and equipment and parts thereof; sound recorders and reproducers, television image and sound recorders and reproducers and parts and accessories of such articles 88 57 Million Aircraft, Spacecraft and parts thereof 38 24 Million Miscellaneous Chemical Products 30 15 Million Pharmaceutical Products 39 8 Million Plastics and articles thereof 73 7 Million Articles of Iron or Steel 49 7 Million Printed books, Newspapers, Pictures and other products of the printing industry; Manuscripts, Typescripts and Plans Grand Total 704 Million Top 10 Chapters Value($USD) Chapter Description 27 128 Million Mineral Fuels, Mineral Oils and Products of their Distillation; Bituminous Substances; Mineral Waxes 84 87 Million Nuclear reactors, boilers, machinery and mechanical appliance; parts thereof 29 56 Million Organic Chemicals 22 46 Million Beverages, Spirits and Vinegar 39 43 Million Plastics and articles thereof 38 30 Million Miscellaneous Chemical Products 08 27 Million Edible Fruit and Nuts; Peel of Citrus Fruit or Melons 28 26 Million Inorganic Chemicals; Organic or Inorganic Compounds of Precious Metals, of Rare-Earth Metals, of Radioactive Elements or of Isotopes 31 25 Million Fertilisers 72 21 Million Iron and Steel Grand Total 487 Million Air - Top 10 chapters that contributes to almost 93% Air Import from USA Sea - Distribution of 72% of Sea imports is in the top 10 chapters. 271 Million 138 Million 96 Million 79 Million 57 Million 24 Million 15 Million 8 Million 7 Million 7 Million Via Air Import of top 10 chapters 49 73 39 30 38 88 85 90 84 71 128 Million 87 Million 56 Million 46 Million 43 Million 30 Million 27 Million 26 Million 25 Million 21 Million Via Sea Import of top 10 chapters 72 31 28 08 38 39 22 29 84 27 7 http://usimports.info |sales@usimports.info|+919331707877|India 息US Imports.Info
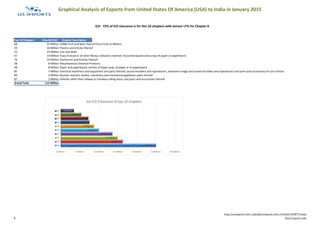
  • 8. Graphical Analysis of Exports from United States Of America (USA) to India in January 2015 Top 10 Chapters Value($USD) Chapter Description 08 25 Million Edible Fruit and Nuts; Peel of Citrus Fruit or Melons 39 16 Million Plastics and articles thereof 72 15 Million Iron and Steel 47 14 Million Pulp of wood or of other fibrous cellulosic material; recovered (waste and scrap) of paper or paperboard 76 10 Million Aluminium and Articles thereof 38 9 Million Miscellaneous Chemical Products 48 8 Million Paper and paperboard; articles of Paper pulp, of paper or of paperboard 85 7 Million Electrical machinery and equipment and parts thereof; sound recorders and reproducers, television image and sound recorders and reproducers and parts and accessories of such articles 84 5 Million Nuclear reactors, boilers, machinery and mechanical appliance; parts thereof 87 3 Million Vehicles other than railway or tramway rolling stock, and parts and accessories thereof Grand Total 112 Million ICD - 72% of ICD clearance is for this 10 chapters with almost 17% for Chapter 8 25 Million 16 Million 15 Million 14 Million 10 Million 9 Million 8 Million 7 Million 5 Million 3 Million 0 Million 5 Million 10 Million 15 Million 20 Million 25 Million 30 Million Via ICD Clearance of top 10 chapters 87 84 85 48 38 76 47 72 39 08 8 http://usimports.info |sales@usimports.info|+919331707877|India 息US Imports.Info
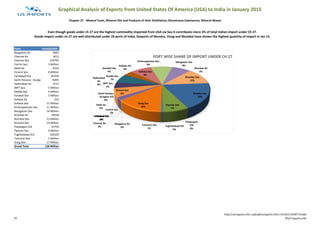
  • 9. Graphical Analysis of Exports from United States Of America (USA) to India in January 2015 Ports Value($USD) Amhedabad Air 30 Million Bangalore Air 343327 Chennai Air 126470 Delhi Air 201 Million Hyderabad Air 495 JNPT Sea 25274 Kolkata Air 1868 Mumbai Air 40 Million Patparganj ICD 39634 Trivendrun Air 3256 Grand Total 271 Million HS Code Value($USD) % Share 71081200 266 Million 98% Gold (including gold plated with platinum) unwrought or in semi-manufactured forms, or in powder for Other Non-Monetary: unwrought forms 71102900 2 Million 1% Platinum, unwrought or in semi- manufactured form, or in powder form - Platinum: Other - Rhodium : 71101120 1 Million 1% Platinum, unwrought or in semi- manufactured form, or in powder form - Platinum: In powder form 71102100 522828 0% Platinum, unwrought or in semi- manufactured form, or in powder form - Platinum: Unwrought or in powder form 71103900 230556 0% Platinum, unwrought or in semi- manufactured form, or in powder form - Platinum: Other - Iridium, osmium and ruthenium: 71069290 214200 0% Silver (including silver plated with gold or platinum), unwrought or in semi-manufactured forms, or in powder form Other 71069210 183458 0% Silver (including silver plated with gold or platinum), unwrought or in semi-manufactured forms, or in powder form Sheets, plates, strips, tubes and pipes 71131910 95353 0% Articles of jewellery and parts thereof, of precious metal - Of metal clad with precious metal: Of gold, unstudded 71104100 62841 0% Platinum, unwrought or in semi- manufactured form, or in powder form - Platinum: Unwrought or in powder from 71051000 31724 0% Dust and powder of natural or synthetic precious or semi-precious stones Of diamonds 71131190 22175 0% Articles of jewellery and parts thereof, of precious metal - Of metal clad with precious metal: Parts 71104900 17314 0% Platinum, unwrought or in semi- manufactured form, or in powder form - Platinum: Other 71131940 15830 0% Articles of jewellery and parts thereof, of precious metal - Of metal clad with precious metal: Of gold, set with other precious and semi-precious stones 71031029 10678 0% 71059000 8932 0% Dust and powder of natural or synthetic precious or semi-precious stones Other 71049000 2836 0% 71141110 2662 0% 71159090 2150 0% Other articles of precious metal or of metal clad with precious metal Other 71031011 1347 0% 71159010 1075 0% Other articles of precious metal or of metal clad with precious metal Laboratory and industrial articles of precious metal 71101900 475 0% Platinum, unwrought or in semi- manufactured form, or in powder form - Platinum: Other - Palladium: 71162000 354 0% Articles of natural or cultured pearls, precious or semi-precious stones(natural, synthetic or reconstructed Of precious or semi-precious stones (natural, synthetic or reconstructed) 71131990 334 0% Articles of jewellery and parts thereof, of precious metal - Of metal clad with precious metal: Parts 71171990 294 0% Imitation Jewellery of base metal, whether or not placed with precious metal : - Of base metal, whether or not plated with precious metal: Other 71039990 274 0% 71081300 29 0% Gold (including gold plated with platinum) unwrought or i8n semi-manufactured forms, or in powder form - Non-monetary: Other semi- manufactured forms Monetary Grand Total 271 Million 100% Goods import under ch 71 where imported via 10 ports of India. Delhi Air having the share of almost 74%. USA stands at second (13%) after Switzerland (25%) on import of goods under Ch 71. Ch 71: Natural or cultured pearls, precious or semi-precious stones, precious metals, metals clad with precious metal, and articles thereof; imitation jewellery; coin Almost 98% of import is carried out under hs code 71081200. Another 25 Hs codes contributes the rest 2%. Precious stones (other than diamonds) and semi-precious stones, whether or not worked or graded but not strung, mounted or set; ungraded precious stones (other than diamonds) and semi-precious stones, temporarily strung for convenience of transport Other - Otherwise worked : Synthetic or reconstructed precious or semi-precious stones, whether or not worked or graded but not strung, mounted or set; ungraded synthetic or reconstructed precious stones, temporarily strung for convenience of transport Other Articles of goldsmiths or silversmiths wares and parts thereof, of precious metal or of metal clad with precious metal - Of precious metal, whether or not plated or clad with precious metal: Articles Precious stones (other than diamonds) and semi-precious stones, whether or not worked or graded but not strung, mounted or set; ungraded precious stones (other than diamonds) and semi-precious stones, temporarily strung for convenience of transport Emerald Precious stones (other than diamonds) and semi-precious stones, whether or not worked or graded but not strung, mounted or set; ungraded precious stones (other than diamonds) and semi-precious stones, temporarily strung for convenience of transport Other Amhedabad Air 11% Bangalore Air 0% Chennai Air 0% Delhi Air 74% Hyderabad Air 0%JNPT Sea 0%Kolkata Air 0% Mumbai Air 15% Patparganj ICD 0% Trivendrun Air 0% PORTS WHERE GOODS UNDER CH 71 ARE IMPORTED 9 http://usimports.info |sales@usimports.info|+919331707877|India 息US Imports.Info
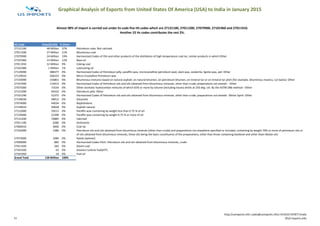
  • 10. Graphical Analysis of Exports from United States Of America (USA) to India in January 2015 Ports Value($USD) Bangalore Air 5605 Chennai Air 1612 Chennai Sea 239792 Cochin Sea 3 Million Delhi Air 6316 Ennore Sea 8 Million Faridabad ICD 81439 Garhi Harsaru - Gurgaon ICD 8395 Hyderabad Air 2157 JNPT Sea 5 Million Kandla Sea 9 Million Karaikal Sea 5 Million Kolkata Air 254 Kolkata Sea 11 Million Krishnapatnam Sea 11 Million Mangalore Sea 10 Million Mumbai Air 19558 Mumbai Sea 15 Million Mundra Sea 24 Million Patparganj ICD 25759 Pipavav Sea 9 Million Tughlakabad ICD 104229 Tuticorin Sea 1 Million Vizag Sea 17 Million Grand Total 128 Million Even though goods under ch 27 are the highest commodity imported from USA via Sea it contributes mere 2% of total Indian import under Ch 27. Goods import under ch 27 are well distributed under 24 ports of India. Seaports of Mundra, Vizag and Mumbai have shown the highest quantity of import in Jan 15. Chapter 27 - Mineral Fuels, Mineral Oils and Products of their Distillation; Bituminous Substances; Mineral Waxes Bangalore Air 0% Chennai Air 0% Chennai Sea 0% Cochin Sea 2% Delhi Air 0% Ennore Sea 6% Faridabad ICD 0% Garhi Harsaru - Gurgaon ICD 0% Hyderabad Air 0% JNPT Sea 4% Kandla Sea 7% Karaikal Sea 4% Kolkata Air 0% Kolkata Sea 9% Krishnapatnam Sea 9% Mangalore Sea 8% Mumbai Air 0% Mumbai Sea 12% Mundra Sea 19% Patparganj ICD 0% Pipavav Sea 7% Tughlakabad ICD 0% Tuticorin Sea 1% Vizag Sea 14% PORT WISE SHARE OF IMPORT UNDER CH 27 10 http://usimports.info |sales@usimports.info|+919331707877|India 息US Imports.Info
  • 11. Graphical Analysis of Exports from United States Of America (USA) to India in January 2015 HS Code Value($USD) % Share 27131100 48 Million 37% Petroleum coke: Not calcined 27011200 27 Million 21% Bituminous coal 27079900 24 Million 19% Harmonised Codes of Oils and other products of the distillation of high temperature coal tar, similar products in which Other 27101960 15 Million 12% Base oil 27011910 12 Million 9% Coking coal 27101980 1 Million 1% Lubricating oil 27129090 388377 0% Harmonised Codes of Petroleum jelly, paraffin wax, microcystalline petroleum wad, slack wax, ozokerite, lignite wax, pet: Other 27129010 206223 0% Micro-Crystalline Petroleum wax 27150090 156801 0% Bituminous mixtures based on natural asphalt, on natural bitumen, on petroleum bitumen, on mineral tar or on mineral tar pitch (for example, bituminous mastics, cut backs): Other 27101990 119412 0% Harmonised Codes of Petroleum oils and oils obtained from bituminous minerals, other than crude; preparations not elsewh: Other 27075000 71634 0% Other aromatic hydrocarbon mixtures of which 65% or more by volume (including losses) distils at 250 deg. cel. By the ASTM D86 method - Other: 27121090 69322 0% Petroleum jelly: Other 27101290 52372 0% Harmonised Codes of Petroleum oils and oils obtained from bituminous minerals, other than crude; preparations not elsewh: Motor Spirit: Other 27149030 48912 0% Gilsonete 27074000 44034 0% Naphthelene 27149010 40028 0% Asphalt natural 27122000 29212 0% Paraffin wax containing by weight less than 0.75 % of oil: 27129040 22398 0% Paraffin wax containing by weight 0.75 % or more of oil 27131200 19885 0% Calcined 27011100 6286 0% Anthracite 27060010 3606 0% Coal tar 27102000 1480 0% 27073000 1084 0% Xylole (xylenes) 27090000 882 0% Harmonised Codes Pitch: Petroleum oils and oils obtained from bituminous minerals, crude 27011920 282 0% Steam coal 27101920 63 0% Aviation turbine fuel(ATF) 27101950 19 0% Fuel oil Grand Total 128 Million 100% Petroleum oils and oils obtained from bituminous minerals (other than crude) and preparations not elsewhere specified or included, containing by weight 70% or more of petroleum oils or of oils obtained from bituminous minerals, these oils being the basic constituents of the preparations, other than those containing biodiesel and other tham Waste oils: Almost 98% of import is carried out under hs code five HS codes which are 27131100, 27011200, 27079900, 27101960 and 27011910. Another 22 Hs codes contributes the rest 2%. 11 http://usimports.info |sales@usimports.info|+919331707877|India 息US Imports.Info
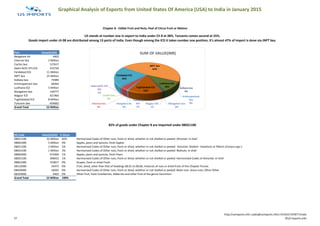
  • 12. Graphical Analysis of Exports from United States Of America (USA) to India in January 2015 Port Value($USD) Bangalore Air 4402 Chennai Sea 2 Million Cochin Sea 137617 Dadri-ACPL CFS ICD 312720 Faridabad ICD 11 Million JNPT Sea 25 Million Kolkata Sea 73989 Krishnapatnam Sea 68364 Ludhiana ICD 5 Million Mangalore Sea 136777 Nagpur ICD 421966 Tughlakabad ICD 8 Million Tuticorin Sea 424662 Grand Total 52 Million HS Code Value($USD) % Share 08021100 42 Million 82% Harmonised Codes of Other nuts, fresh or dried, whether or not shelled or peeled: Almonds: In shell 08081000 5 Million 9% Apples, pears and quinces, fresh Apples 08021200 2 Million 5% Harmonised Codes of Other nuts, fresh or dried, whether or not shelled or peeled: Almonds: Shelled - Hazelnuts or filberts (Corylus spp ): 08023100 1 Million 3% Harmonised Codes of Other nuts, fresh or dried, whether or not shelled or peeled: Walnuts: In shell 08083000 474360 1% Apples, pears and quinces, fresh Pears 08025100 348423 1% Harmonised Codes of Other nuts, fresh or dried, whether or not shelled or peeled: Harmonised Codes of Almonds: In shell 08061000 143817 0% Grapes, fresh or dried Fresh 08132000 34475 0% Fruit, dried, other than that of headings 08.01 to 08.06; mixtures of nuts or dried fruits of this Chapter Prunes 08029000 18292 0% Harmonised Codes of Other nuts, fresh or dried, whether or not shelled or peeled: Betel nuts: Areca nuts: Other Other 08104000 4402 0% Other fruit, fresh Cranberries, bilberries and other fruit of the genus Vaccinium Grand Total 52 Million 100% Chapter 8 - Edible Fruit and Nuts; Peel of Citrus Fruit or Melons US stands at number one in export to India under Ch 8 at 38%. Tanzania comes second at 25%. Goods import under ch 08 are distributed among 13 ports of India. Even though among the ICD it takes number one position, it's almost 47% of import is done via JNPT Sea. 82% of goods under Chapter 8 are imported under 08021100 Bangalore Air 0% Chennai Sea 3% Cochin Sea 0% Dadri-ACPL CFS ICD 1% Faridabad ICD 22% JNPT Sea 47% Kolkata Sea 0% Krishnapatnam Sea 0% Ludhiana ICD 10% Mangalore Sea 0% Nagpur ICD 1% Tughlakabad ICD 15% Tuticorin Sea 1% SUM OF VALUE(INR) 12 http://usimports.info |sales@usimports.info|+919331707877|India 息US Imports.Info
  • 13. Graphical Analysis of Exports from United States Of America (USA) to India in January 2015 Thank you for viewing this analytical report. Please note: This analysis in accordance with India Trade Classification Harmonised Code. Information is based on receipt of goods in India in Jan 2015 from USA Further analysis and customisation is possible as per the requirement TEAM US IMPORTS. INFO Copyright: All material on these pages, including without limitation text, logos, icons, photographs and all other artwork, is copyright material of Mahavir Law House, unless otherwise stated. Use may be made of these pages for non-commercial purposes without permission from the copyright holder. Commercial use of this material may only be made with the express, prior, written permission of Mahavir Law House. Disclaimer: Mahavir Law House seeks to ensure that information contained in these pages is accurate. However, no liability, or responsibility is accepted arising from reliance upon the information contained in these pages. 13 http://usimports.info |sales@usimports.info|+919331707877|India 息US Imports.Info