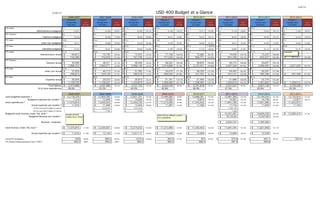
This document provides budget information for USD 400 from 2006-2007 to 2013-2014. It shows numbers for staffing levels and salaries, total budgeted and actual expenses, revenues, and other financial metrics. Overall, salaries have increased each year, though the rate of increase has varied. Budgeted expenses have generally increased annually between 96.6-107.9%, while actual expenses have increased at a lower rate between 91.6-108.8%. Revenues have fluctuated from year to year between 91.7-105.7% of the previous year.
The Boeing Company is an American multinational corporation that designs, manufactures, and sells airplanes, rockets, and satellites worldwide. It operates through five business segments: Commercial Airplanes, Boeing Military Aircraft, Network & Space Systems, Global Services & Support, and Boeing Capital. Key financial details include a market cap of $102.95 billion and net earnings of $5.446 billion in 2014. Boeing's largest segment is Commercial Airplanes, which accounted for 66.1% of total revenues and 85.8% of earnings from operations in 2014. The company also derives revenue from defense, space, and security contracts through its Boeing Military Aircraft, Network & Space Systems, and Global Services & Support segments.
University Faculty Senate Presentaiton: Overview of Contributions Report Marc...Larry Cat叩 Backer
油
The document provides an overview and recommendations from the Faculty Benefits Committee regarding employee contributions to health insurance plans at Penn State. It discusses the history of contribution models and recommends returning to a modest salary indexing model from 2012. It also finds evidence of cost shifting between the university's PPO Blue and PPO Savings plans, with higher-income employees in the PPO Savings plan receiving substantially larger university contributions. The committee recommends eliminating differences in university contributions between plans and income levels to provide equitable compensation.
Analysis by the Legislative Finance Division of Alaska's fiscal position: how we got here, where we are and where we are headed under various alternatives.
Este documento describe el uso de la rob坦tica en la educaci坦n en diferentes niveles. Explica que la rob坦tica promueve el aprendizaje colaborativo y experimental, y ayuda a desarrollar habilidades como la creatividad, el an叩lisis y la resoluci坦n de problemas. Se enfoca en los sistemas Lego Mindstorms y describe varios modelos de robots Lego y sus caracter鱈sticas. Tambi辿n discute c坦mo la rob坦tica puede usarse en la educaci坦n primaria, secundaria y universitaria para ense単ar diversas materias.
El documento explica que el derecho de autor es un conjunto de normas que protege a los autores y titulares de obras al otorgarles el control sobre el uso y explotaci坦n de sus creaciones. Protege todo tipo de obras literarias y art鱈sticas independientemente de su forma de expresi坦n. Sus caracter鱈sticas son que surge de la creaci坦n personal y otorga derechos morales y patrimoniales a los autores.
This document provides financial information for Kroger from 2008-2022. It includes historical and forecasted data on store counts, capital expenditures, property/equipment, depreciation expenses, and income statements. Some key points:
- Kroger opened 107-150 new stores per year from 2008-2012 and forecasts 40 new stores annually through 2022.
- Capital expenditures are forecasted to increase annually from $455.7 million in 2013 to $1.055 billion in 2021 to support new store growth.
- Property/equipment is forecasted to increase from $15.3 billion in 2012 to over $33 billion in 2021 due to capital expenditures exceeding depreciation expenses.
- Net earnings are
This document contains a financial model for a consumer packaged goods company over a 13 year period from 2020-2033. It includes assumptions for variables like inflation, exchange rates and tax rates. The model builds up the income statement with projections for revenues, costs of goods sold, operating expenses, EBITDA, depreciation and EBIT for two products. Revenues are projected based on volume and price growth assumptions, while costs are split into variable and fixed portions with projected growth rates.
The document provides financial data for a company from 2003 to 2009E, including operating profit, interest expense, pretax earnings, operating cash flow, capital expenditures, free cash flow, net earnings, sales, and underlying sales growth by business group. Key metrics like operating margin, pretax margin, and free cash flow as a percentage of sales and net earnings are also shown historically and for 2009 estimates. Underlying sales growth is broken out between currency/acquisition/divestiture impacts and total sales growth for both the total company and by business group.
This document presents a discounted cash flow analysis of Eastman Chemical Company using an exit multiple method valuation approach. It forecasts the company's financial statements from 2013 to 2021 and discounts the projected 2021 unlevered free cash flow using a WACC of 7.9% to calculate a terminal value. Adding the present value of interim cash flows yields an implied enterprise value of $20.55 billion, equivalent to an exit multiple of 10.4x 2021 EBITDA. Sensitivity analyses show the valuation's sensitivity to changes in perpetual growth rate and WACC.
This webinar was hosted by Dan Matarrese (Tax Senior Manager) from McKonly & Asbury. The presentation provided an annual State of the Tax Union address. We detailed the relevant changes in our tax system for 2014 while also discussing planning opportunities that exist in our current environment. Our team will provided a unique look at the most recent IRS statistics to examine the economic results that our tax policies are producing.
Check out our Upcoming Events page for news and updates on our future seminars and webinars at http://www.macpas.com/events/
- The document presents a discounted cash flow valuation for International Flavors & Fragrances, Inc. under an "Upside" operating scenario from 2013-2021.
- Key projections include total revenue growing at a 3.2% CAGR from 2016-2021, EBITDA margins of 25.5%, and unlevered free cash flow growing at a 3.6% CAGR over the projection period.
- The valuation results in an implied enterprise value of $10.4 billion and implied equity value of $9.3 billion, representing an upside case from the base scenario.
This document provides an overview of Nelnet's business segments and financial performance. The key segments are:
- NDS: Student loan origination and servicing software for government and private loans. Services over $200B in loans.
- NBS: Tuition payment plans and school software. Serves 13,500 K-12 schools and 970 colleges.
- ALLO: Fiber optic network providing internet, phone, TV to businesses and residences in underserved areas.
- AGM: Manages $23B in student loans expected to generate $2B in future cash flows.
The document reviews financial metrics like revenue, expenses, margins and cash flows by segment from 2007-2017. Overall
This document provides an overview of Nelnet's business segments and financial performance. The key points are:
- Nelnet has four business segments: NDS (loan origination/servicing software), NBS (education payment processing software), AGM (student loan asset management), and ALLO (fiber network provider).
- Over the past decade, Nelnet has diversified its business and grown revenues across all segments. Adjusted net income has increased from $41 million in 2007 to over $200 million in recent years.
- Nelnet services over $195 billion in student loans for nearly 10 million borrowers. Its student loan portfolio is expected to generate $2.07 billion in future cash flows.
Brunswick (BC) Pitch - Jonathan Chang - FINAL COPYJonathan Chang
油
This document provides financial projections and valuation metrics for Brunswick Corporation and several peers. It includes estimates of revenue and EBITDA growth for Brunswick from 2014 to 2018 under analyst, conservative, base, and optimistic scenarios. It also shows discounted cash flow analyses for Brunswick using a range of terminal growth and EBITDA multiple assumptions. The document indicates Brunswick currently trades at a premium or discount to peer median valuation metrics.
The document summarizes Arteris' financial results for the fourth quarter and full year of 2012. It provides information on tolled traffic, toll tariffs, gross revenue composition, costs and expenses, and operational performance including adjusted EBITDA. Key highlights include a 3.9% increase in tolled traffic for 4Q12 compared to 4Q11 and a 6.7% increase in average toll tariff. Adjusted EBITDA was R$1,195 million for 2012 with a margin of 65.7%.
The 2014 local municipal budget summary shows a $727,483 increase over the 2013 budget. Key drivers of increased expenses include $915,000 for health insurance, $621,500 for salaries and wages, and $208,023 for debt service. Revenues are increased through $1,261,730 raised by local taxation, $395,119 in anticipated miscellaneous revenues, and $300,000 from available fund balance. Several items reduced the budget increase, including $-62,116 for the library appropriation and $-842,000 from accelerated Sandy reimbursements. The total tax levy and tax rate are increased to cover remaining budget needs.
This document provides an overview of Nelnet's business segments and financial performance. The key points are:
- Nelnet has four business segments: NDS (loan origination and servicing software), NBS (education planning and payment software), AGM (student loan asset management), and ALLO (fiber optic network provider).
- Over the past decade, Nelnet has diversified its business and grown revenues across all segments. Adjusted net income has increased from $41 million in 2007 to over $200 million in recent years.
- Nelnet services over $195 billion in student loans for nearly 10 million borrowers. Its student loan portfolio is expected to generate $2.07 billion in future cash
Cfa research presentation university at buffalo Ke Guo
油
The document provides an analysis of Columbus McKinnon Corporation (CMCO), a manufacturer of material handling products. Some key points:
- CMCO is the #1 manufacturer of hoists, tire shredders, cranes, and other material handling products in the US.
- Hoists make up 58.9% of revenue. CMCO has invested in R&D and acquisitions to grow.
- A DCF valuation estimates CMCO's fair value at $25.73 per share, while relative valuation estimates $23.77-$27.16 per share.
- The analysis identifies CMCO's strong market position but notes risks from competition and economic cycles.
This document provides financial statements and ratios for Hansson Private Label from 2003-2007. It also includes projections for Hansson with a proposed expansion from 2009-2018. Key information includes:
- Hansson's revenue, earnings, and margins have grown from 2003-2007. Net income margin has remained steady at around 5.7%.
- Projections estimate revenue will grow from $84.96M in 2009 to $144.16M in 2018 with the expansion. Net income is estimated to grow from $2.83M to $9.56M over this period.
- The proposed expansion will require a $57.82M investment and is estimated to have a positive NPV of $36
The document shows data on various financial metrics for multiple counties in Texas from 2011 to 2015. It includes information on wage increases, employee to citizen ratios, unemployment rates, and annual budgets and budget changes for county governments. Specifically, it highlights lump sum payments made to retirement funds, including $40.5 million to TCDRS in 2011 and $11.6 million to TCDRS in 2014.
The document shows statistics for various Texas counties from fiscal years 2011 to 2015. It includes data on wage increases, employee to citizen ratios, unemployment rates, and annual budgets and budget changes for several counties. Notably, it indicates that Collin County provided wage increases of 12% over the period while making lump sum payments totaling over $40 million to its pension fund in 2011 and over $11 million in 2014.
The document shows statistics for various Texas counties from fiscal years 2011 to 2015. It includes data on wage increases, employee to citizen ratios, unemployment rates, and city/county budget amounts. Several counties provided lump sum payments to their pension funds (TCDRS) during this period to address funding shortfalls.
Exploring the State of Facilities 2014 [Part 4]: Operations Effectiveness & E...Sightlines
油
During this webinar, Sightlines Vice President Jim Kadamus and Associate Vice President Jay Pearlman offer an in-depth discussion of the benchmarks, trends, and best practices introduced in our 2014 report The State of Facilities in Higher Education.
Part 4 explores the challenges of the day-to-day operations on campus that are caused by flat operating budgets that are unable to keep up with inflation, increasing staffing coverages, and an inability to protect energy savings. In response, strategies for increasing planned maintenance investments to offset scarce resources and examples of policy shifts that have allowed facilities leaders to protect and re-allocate energy savings are also discussed.
This document provides an overview of Caltrans District 7 construction projects for 2012. It includes statistics on the number and value of ongoing construction contracts across California districts. District 7 has 101 ongoing contracts worth $1.6 billion, accounting for 16.5% of statewide contracts. Several major projects in District 7 are highlighted, including improvements to the I-5, SR-110, and the Gerald Desmond Bridge replacement. Contact information is provided for finding additional details on specific contracts.
KENYA AIRWAYS STATEMENT ANALYSIS- CIFA LUDENYOJESSELUDENYO
油
KSH M's forecasts its financial performance from 2018 to 2024. Revenue is projected to grow 11.8% annually while costs grow at slower rates. This leads to increasing gross and net profits over time. EBITDA is forecasted to increase from a loss of $10.9 million in 2018 to a profit of $22.6 million in 2024. Common size income statements show improving margins as costs decline as a percentage of revenue.
Dr. Ansari Khurshid Ahmed- Factors affecting Validity of a Test.pptxKhurshid Ahmed Ansari
油
Validity is an important characteristic of a test. A test having low validity is of little use. Validity is the accuracy with which a test measures whatever it is supposed to measure. Validity can be low, moderate or high. There are many factors which affect the validity of a test. If these factors are controlled, then the validity of the test can be maintained to a high level. In the power point presentation, factors affecting validity are discussed with the help of concrete examples.
Odoo 18 Accounting Access Rights - Odoo 18 際際滷sCeline George
油
In this slide, well discuss on accounting access rights in odoo 18. To ensure data security and maintain confidentiality, Odoo provides a robust access rights system that allows administrators to control who can access and modify accounting data.
Comprehensive Guide to Antibiotics & Beta-Lactam Antibiotics.pptxSamruddhi Khonde
油
Comprehensive Guide to Antibiotics & Beta-Lactam Antibiotics
Antibiotics have revolutionized medicine, playing a crucial role in combating bacterial infections. Among them, Beta-Lactam antibiotics remain the most widely used class due to their effectiveness against Gram-positive and Gram-negative bacteria. This guide provides a detailed overview of their history, classification, chemical structures, mode of action, resistance mechanisms, SAR, and clinical applications.
What Youll Learn in This Presentation
History & Evolution of Antibiotics
Cell Wall Structure of Gram-Positive & Gram-Negative Bacteria
Beta-Lactam Antibiotics: Classification & Subtypes
Penicillins, Cephalosporins, Carbapenems & Monobactams
Mode of Action (MOA) & Structure-Activity Relationship (SAR)
Beta-Lactamase Inhibitors & Resistance Mechanisms
Clinical Applications & Challenges.
Why You Should Check This Out?
Essential for pharmacy, medical & life sciences students.
Provides insights into antibiotic resistance & pharmaceutical trends.
Useful for healthcare professionals & researchers in drug discovery.
Swipe through & explore the world of antibiotics today!
Like, Share & Follow for more in-depth pharma insights!
AI and Academic Writing, Short Term Course in Academic Writing and Publication, UGC-MMTTC, MANUU, 25/02/2025, Prof. (Dr.) Vinod Kumar Kanvaria, University of Delhi, vinodpr111@gmail.com
Effective Product Variant Management in Odoo 18Celine George
油
In this slide well discuss on the effective product variant management in Odoo 18. Odoo concentrates on managing product variations and offers a distinct area for doing so. Product variants provide unique characteristics like size and color to single products, which can be managed at the product template level for all attributes and variants or at the variant level for individual variants.
1. 5/6/14
4/30/14 USD 400 Budget at a Glance
2006-2007 2007-2008 2008-2009 2009-2010 2010-2011 2011-2012 2012-2013 2013-2014
Employee # Employee # Employee # Employee # Employee # Employee # Employee # Employee #
Average Salary % of Average Salary % of Average Salary % of Average Salary % of Average Salary % of Average Salary % of Average Salary % of Average Salary % of
Total Salary increase Total Salary increase Total Salary increase Total Salary increase Total Salary increase Total Salary increase Total Salary increase Total Salary increase
FTE Admin 11 12.3 11.5 10.3 11.2 11.1 10.3 11.3
Administrators budgeted 65,007$ 64,586$ 99.4% 67,856$ 105.1% 72,395$ 106.7% 74,311$ 102.6% 74,130$ 99.8% 78,642$ 106.1% 77,656$ 98.7%
FTE Teachers 63 64 65 62 64 60 61 59
Teachers budgeted 42,420$ 48,480$ 114.3% 48,846$ 100.8% 46,201$ 94.6% 46,237$ 100.1% 49,207$ 106.4% 49,791$ 101.2% 50,134$ 100.7%
FTE other 12.8 14.4 19.2 13.8 7.6 9.8 9.7 7.6
other cert budgeted 40,611$ 40,806$ 100.5% 43,220$ 105.9% 41,563$ 96.2% 38,942$ 93.7% 38,015$ 97.6% 44,394$ 116.8% 59,402$ 133.8%
FTE Class 41.2 42.7 42.8 39.3 40.3 1.0254 39 41.7 40.9
Classified budgeted 22,547$ 28,541$ 126.6% 29,940$ 104.9% 31,594$ 105.5% 31,723$ 100.4% 30,862$ 97.3% 33,114$ 107.3% 35,191$ 106.3%
FTE Admin 11.3 10.6 10.6 10 11.1 11.1 11.3
Administrators actual 64,813$ 70,185$ 108.3% 72,425$ 103.2% 77,106$ 106.5% 72,682$ 94.3% 74,936$ 103.1% 75,525$ 100.8%
732,390$ 743,959$ 101.6% 767,709$ 103.2% 771,056$ 100.4% 806,771$ 104.6% 831,790$ 103.1% 853,427$ 102.6% 877,511$ 102.8%
FTE Teachers 64 62 64 62 64 60 61
Teachers actual 45,098$ 48,311$ 107.1% 48,409$ 100.2% 48,563$ 100.3% 48,835$ 100.6% 49,125$ 100.6% 50,647$ 103.1%
2,886,253$ 2,995,271$ 103.8% 3,098,148$ 103.4% 3,010,888$ 97.2% 3,125,451$ 103.8% 2,947,520$ 94.3% 3,089,485$ 104.8% 2,957,929$ 95.7%
FTE other 14.4 13.1 19.1 16.3 7.6 9.7 8.7
other cert actual 37,959$ 40,773$ 107.4% 31,383$ 77.0% 34,910$ 111.2% 46,205$ 132.4% 44,445$ 96.2% 56,597$ 127.3%
546,613$ 534,129$ 97.7% 599,419$ 112.2% 569,035$ 94.9% 351,161$ 61.7% 431,121$ 122.8% 492,396$ 114.2% 451,456$ 91.7%
FET Class 42.7 39.5 41.9 40.7 40.9 41.9 41.5
Classified actual 26,926$ 29,325$ 108.9% 29,973$ 102.2% 31,191$ 104.1% 31,993$ 102.6% 31,996$ 100.0% 33,779$ 105.6%
1,149,730$ 1,158,321$ 100.7% 1,255,879$ 108.4% 1,269,480$ 101.1% 1,308,495$ 103.1% 1,340,616$ 102.5% 1,401,820$ 104.6% 1,439,313$ 102.7%
Total Salaries 5,314,986$ 5,431,680$ 102.2% 5,721,155$ 105.3% 5,620,459$ 98.2% 5,591,878$ 99.5% 5,551,047$ 99.3% 5,837,128$ 105.2% 5,726,209$ 98.1%
% of total expenditures 48.0% 45.2% 46.5% 49.8% 48.4% 47.5% 49.4% 49.3%
2006-2007 2007-2008 2008-2009 2009-2010 2010-2011 2011-2012 2012-2013 2013-2014
total budgeted expenses ^ 12,178,378$ 12,904,382$ 106.0% 13,921,701$ 107.9% 13,449,083$ 96.6% 13,668,361$ 101.6% 13,981,380$ 102.3% 14,144,550$ 101.2% 13,735,910$ 97.1%
Budgeted expenses per student ^ 11,016$ 12,840$ 116.6% 14,059$ 109.5% 13,582$ 96.6% 13,874$ 102.1% 14,381$ 103.7% 14,146$ 98.4% 13,877$ 98.1%
total expenditures * 11,070,816$ 12,020,023$ 108.6% 12,304,720$ 102.4% 11,275,090$ 91.6% 11,545,453$ 102.4% 11,691,180$ 101.3% 11,821,966$ 101.1% 11,622,972$
Actual expenses per student * 11,016$ 11,960$ 108.6% 12,426$ 103.9% 11,387$ 91.6% 11,566$ 101.6% 11,716$ 101.3% 11,944$ 101.9% 11,743$
#s from year before budget at a glance 12,020,651$ 12,214,252$ 11,691,181$
#s from year before budget at a glance 11,961$ 12,335$ 11,692$
Budgeted total revenue, state, fed, local * 14,341,287$ 14,604,250$ 101.8% 13,395,315$ 91.7%
Budgeted Revenue per student * 14,725.63$ 15,501.80$ 105.3%
Revenue - Expenses 2,650,107$ 2,782,284$
total revenue, state, fed, local * 11,070,816$ 111.6% 12,020,651$ 108.6% 12,214,252$ 101.6% 11,275,090$ 92.3% 11,545,452$ 102.4% 11,691,181$ 101.3% 11,821,966$ 101.1%
Actual expenses per student * 11,016$ 111.8% 12,140$ 110.2% 12,017.17$ 99.0% 11,349$ 94.4% 12,064$ 106.3% 12,004$ 99.5% 12,549$ 104.5%
Actual FTE enrollment 1005 99.8% 990.2 98.5% 1016.4 102.6% 993.5 97.7% 957 96.3% 0 973.9 101.8% # 942.1 96.7% 952.4 101.1%
FTE Actual including preschool (form 1000) * 990.2 #REF! 990.2 #REF! 990.2 990.2 988.5 997.9 989.8
includes all funds
(capital, bond, virtual)
2009-2010 has different numbers
from republishing
contracted
2. These numbers are taken from Budget at a Glance
2000-2001 2001-2002 2002-2003 2003-2004 2004-2005 2005-2006 2006-2007
total Budgeted Expenses
total expenditure 12,178,378$
total Actual Expenses
total expenditures 9,114,119$ 9,920,003$ 108.8% 11,070,816$
These numbers ar
general fund budget
general fund actuals
contingency reserve July 1st Balance 240,662$ 391,552$
Actual sources of Revenue These numbers are taken from Smoky Valley (USD DO400) Mcpherson C
State Aid 5,275,399$ 5,365,918$ 101.7% 5,827,921$ 108.6% 5,414,875$ 92.9% 5,922,546$ 109.4% 6,780,447$ 114.5% 7,764,679$
Federal Aid 163,029$ 164,369$ 100.8% 171,830$ 104.5% 178,186$ 103.7% 319,038$ 179.0% 313,373$ 98.2% 331,823$
Local Revenue 2,344,007$ 2,184,821$ 93.2% 2,194,057$ 100.4% 2,922,562$ 133.2% 2,872,535$ 98.3% 2,826,181$ 98.4% 2,974,314$
total revenue 7,782,435$ 7,715,108$ 99.1% 8,193,808$ 106.2% 8,515,623$ 103.9% 9,114,119$ 107.0% 9,920,001$ 108.8% 11,070,816$
State Aid per student 5,295$ 5,394$ 101.9% 6,205$ 115.0% 5,879$ 94.8% 6,234$ 106.0% 6,736$ 108.1% 7,726$
Federal Aid per student 164$ 165$ 101.0% 183$ 110.7% 193$ 105.8% 336$ 173.6% 311$ 92.7% 330$
Local Revenue per student 2,353$ 2,196$ 93.3% 2,336$ 106.4% 3,173$ 135.9% 3,023$ 95.3% 2,808$ 92.9% 2,960$
total spent per student 7,811$ 7,755$ 99.3% 8,723$ 112.5% 9,246$ 106.0% 9,593$ 103.8% 9,855$ 102.7% 11,016$
Enrollment (FTE)* for Budget Authority 996.3 0 994.8 99.8% 939.3 94.4% 921 98.1% 950.1 103.2% 1006.6 105.9% 1005
includes all funds (capital, bond,
virtual)
from 2008-2009
Budget at a Glace
10% of general fund budget is max
tried to close MJH
3. 2007-2008 2008-2009 2009-2010 2010-2011 2011-2012 2012-2013 2013-2014
12,904,382$ 106.0% 13,921,701$ 107.9% 13,449,083$ 96.6% 13,668,361$ 101.6% 13,981,380$ 102.3% 14,144,550$ 101.2% 13,735,910$ 97.1%
111.6% 12,020,023$ 108.6% 12,304,720$ 102.4% 11,275,090$ 91.6% 11,545,453$ 102.4% 11,691,181$ 101.3% 11,821,966$ 101.1%
12,020,651$ 12,214,252$
Budgeted sources of Revenue
State 7,336,879$ 7,288,960$ 99.3% 7,236,510$ 99.3%
Federal 372,059$ 365,796$ 98.3% 280,632$ 76.7%
Local 6,632,349$ 6,949,494$ 104.8% 5,878,173$ 84.6%
total revenue 14,341,287$ 14,604,250$ 101.8% 13,395,315$ 91.7%
11,944$
budgeted rev-accual exp 2,650,106$ 2,782,284$
numbers are taken from the Budget USD#400 - Smoky Valley
6,949,999$ 6,742,567$ 6,862,232$ 6,775,221$ 6,695,860$
7,969,019$ 7,954,329$ 6,840,633$ 6,749,650$ 7,050,483$ 6,853,681$
411,220.86$ 6.0%
409,467$ 426,797$ 737,142$ 737,142$ 737,142$ 498,142$ 396,686$
cpherson County, KDOE website
Last 13 year %
increase
114.5% 8,433,477$ 108.6% 8,449,210$ 100.2% 6,852,467$ 81.1% 6,944,054$ 101.3% 7,336,879$ 105.7% 7,288,960$ 99.3% 138.2%
105.9% 254,341$ 76.6% 276,729$ 108.8% 876,230$ 316.6% 682,923$ 77.9% 372,059$ 54.5% 365,796$ 98.3% 224.4%
105.2% 3,332,833$ 112.1% 3,488,313$ 104.7% 3,546,393$ 101.7% 3,918,475$ 110.5% 3,982,243$ 101.6% 4,167,210$ 104.6% 177.8%
111.6% 12,020,651$ 108.6% 12,214,252$ 101.6% 11,275,090$ 92.3% 11,545,452$ 102.4% 11,691,181$ 101.3% 11,821,966$ 101.1% 151.9%
114.7% 8,517$ 110.2% 8,313$ 97.6% 6,897$ 83.0% 7,256$ 105.2% 7,534$ 103.8% 7,737$ 102.7% 146.1%
106.1% 257$ 77.8% 272$ 106.0% 882$ 323.9% 714$ 80.9% 382$ 53.5% 388$ 101.6% 237.3%
105.4% 3,366$ 113.7% 3,432$ 102.0% 3,570$ 104.0% 4,095$ 114.7% 4,089$ 99.9% 4,423$ 108.2% 188.0%
111.8% 12,140$ 110.2% 12,017$ 99.0% 11,349$ 94.4% 12,064$ 106.3% 12,004$ 99.5% 12,549$ 104.5% 160.6%
99.8% 990.2 98.5% 1016.4 102.6% 993.5 97.7% 957 96.3% 973.9 101.8% 942.1 96.7% 952.4 101.1%
Budget at a Glance #
9
ace
from 2009-2010 Budget at a Glance
Verual School funding
changed
State Pre-K funded at
this year and therafter 6% of general fund budget
is maxMJH closed
closed MES 4th grade
Closed MES