Using GIS data at GCSE
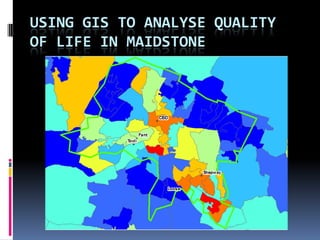
- 1. Using GIS to analyse quality of life in Maidstone
- 2. This presentation poses questions for you to think about when looking at patterns of quality of life.Can you write this into your analysis?Your may need to update your conclusions!
- 3. What to look forTry to describe the overall pattern of deprivation i.e. where is the quality of life higher and lowerCan you relate this to the simple layout of a settlement i.e. CBD, inner city, outer suburbsCan you use phrases like âto the North, in the South-Eastâ.
- 4. Reflect on the patternsDoes this pattern of quality of life surprise you?Can add number labels to your areas and then work out which place has the highest and lowest quality of life in Maidstone?If you were conducting further fieldwork, which extra sites would you visit?Should we have chosen different sites?


