Using graphs technologies for intelligence analysis.
•
1 like•506 views

Discover how to use graph patterns to detect terrorist threats and how to investigate suspicious networks with graph visualization in Linkurious.
1 of 23
Downloaded 16 times


Recommended
Fighting financial crime with graph analysis at BIWA Summit 2017
Fighting financial crime with graph analysis at BIWA Summit 2017Linkurious
Ěý
Additional details on our blog: https://linkurio.us/visualize-oracle-graph-data-ogma-library/
Discover how to use graph analysis to identify suspicious connections and unmask criminals. In this session, Jean will share his experience working on the Panama Papers or with banks and insurance companies (first-party fraud, anti-money laundering, insurance fraud). He will explain how to combine the kind of graph analytics enabled by Oracle Spatial and Graph with powerful graph visualization to help analysts detect, investigate and stop financial crime.
La visualisation au service de la lutte contre la fraudeLinkurious
Ěý
La visualisation de graphes de Linkurious et les bases de données Neo4j permettent de renforcer les systèmes de lutte contre la fraude.The 8 most common graph visualization mistakes
The 8 most common graph visualization mistakesLinkurious
Ěý
This document outlines 8 common mistakes made in graph visualizations: 1) Not setting clear business objectives for the visualization. 2) Not considering the needs of end users. 3) Treating visualization as an art project rather than a tool. 4) Not adding interactivity for users to explore the data. 5) Not properly preparing and modeling the underlying graph data. 6) Not providing guidance to help users correctly interpret the visualization. 7) Attempting to display all nodes and edges rather than focusing on the most relevant information. 8) Failing to address operational questions about security, scalability and maintenance for production use.Panama papers: how ICIJ used Linkurious to investigate the Mossack Fonseca leaks
Panama papers: how ICIJ used Linkurious to investigate the Mossack Fonseca leaksLinkurious
Ěý
This document provides an overview of the Panama Papers investigation which involved over 400 journalists reviewing millions of documents leaked from a Panamanian law firm. The investigation took over a year and involved analyzing the data in the cloud to link people and companies in order to reveal hidden dealings and uncover fraud. Key facts of the leak were that it contained information on over 200,000 offshore entities connected to public officials across the world.Finding answers through visualization (GraphDay Barcelona Feb 2016)
Finding answers through visualization (GraphDay Barcelona Feb 2016)Linkurious
Ěý
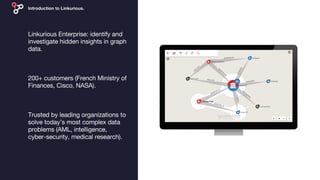
Linkurious is a graph visualization startup that helps companies understand and analyze graph data. It offers Linkurious Enterprise, a graph visualization application compatible with Neo4j graph databases. It also offers Linkurious.js, a JavaScript library to build custom graph visualization applications. Linkurious has over 200 customers, including NASA, the French Ministry of Finances, and Cisco. It provides easy to use interfaces for non-technical users to uncover hidden relationships and extract insights from connected data stored in graph databases.Reinforcing AML systems with graph technologies.
Reinforcing AML systems with graph technologies.Linkurious
Ěý
Anti-money laundering (AML) has become complex and costly for institutions and enterprises. Nowadays, to thwart criminal intricate strategies, financial crime units have to gather, monitor and investigate large amounts of connected data.
Graph analysis and visualization technologies can provide an holistic view of the various entities and their relationships to unveil wrongdoings.
Anti-money laundering (AML) has become complex and costly for institutions and enterprises. Graph analysis and visualization technologies like Linkurious are a great fit to help AML analysts fight money laundering.
Discover in this presentation how to automate the monitoring of high risk customers with patterns alerts and how to assess risk-levels by visually investigating suspicious cases.
More information on www.linkurio.usLinkurious SDK: Build enterprise-ready graph applications faster
Linkurious SDK: Build enterprise-ready graph applications fasterLinkurious
Ěý
Graph technologies have the potential to help businesses understand complex connected data. From financial crime to cyber-security to IT management, specific business requires custom applications. This is why we created the Linkurious SDK , a toolkit that enables you to quickly build secure and flexible applications to leverage the connections within your data or unveil hidden relationships.
Discover in this presentation the challenges of integrating graph technologies into enterprise applications; and how to use the Linkurious SDK to build a robust, secure and interactive graph application.Graph analysis of the European public tenders
Graph analysis of the European public tendersLinkurious
Ěý
Linkurious is a graph visualization startup that helps companies understand graph data. They developed Linkurious Enterprise, an enterprise-ready graph visualization platform, and linkurious.js, an open-source JavaScript graph visualization library. As an example, they visualized data on European public tenders as a graph using Neo4j. This allowed them to explore connections between firms and identify contracts a firm's customers awarded to its competitors.Linkurious Enterprise: graph visualization platform neo4j
Linkurious Enterprise: graph visualization platform neo4jLinkurious
Ěý
Linkurious is a French startup founded in 2013 that provides the first graph visualization platform for Neo4j. It allows users to easily visualize and explore graph data stored in Neo4j to accelerate analysis and improve decision making. Linkurious offers starter, enterprise, and toolkit pricing plans starting at 990 euros per user per year for basic search and exploration of data.GraphX and Pregel - Apache Spark
GraphX and Pregel - Apache SparkAshutosh Trivedi
Ěý
A nice use case of GraphX of Apache Spark in solving Feedback Vertex Set. Pregel usecase in Geographical Systems.Building a Graph of all US Businesses Using Spark Technologies by Alexis Roos
Building a Graph of all US Businesses Using Spark Technologies by Alexis RoosSpark Summit
Ěý
This document discusses building a graph of U.S. businesses using Spark technologies. It describes how Radius Intelligence builds a comprehensive business graph from multiple data sources by acquiring and preparing raw data, clustering records, and constructing the graph by linking business and location vertices and attributes through techniques like connected components analysis. Key lessons learned include that GraphX scales well, graph construction and updates are easy using RDD operations, and connected components analysis is an expensive graph operation.Using graph technologies to fight fraud
Using graph technologies to fight fraudLinkurious
Ěý
Learn how to use graph technologies to fight fraud. Combine the power of the Neo4j graph database with an easy to use graph visualization tool.Business Intelligence Presentation (1/2)
Business Intelligence Presentation (1/2)Bernardo Najlis
Ěý
Business Intelligence made easy! This is the first part of a two-part presentation I prepared for one of our customers to help them understand what Business Intelligence is and what can it do...Business intelligence ppt
Business intelligence pptsujithkylm007
Ěý
Business intelligence (BI) provides processes, technologies, and tools to help organizations analyze data and make better business decisions. BI technologies gather, store, analyze and provide access to enterprise data. This helps users understand what happened in the past, what is happening currently, and make plans to achieve desired future outcomes. BI provides a single point of access to information, timely answers to business questions, and allows all departments to use data for decision making. Key BI tools include dashboards, key performance indicators, graphical reporting, forecasting, and data visualization. These tools help analyze trends, customer behavior, market conditions, and support risk analysis and decision making.Using graph technology for multi-INT investigations
Using graph technology for multi-INT investigationsLinkurious
Ěý
Linkurious is a graph analysis software that helps organizations identify insights hidden in complex data by providing a unified view of information from different sources and enabling new analytical capabilities. It breaks down data silos and reduces complexity for multi-INT (intelligence integration) investigations. The presentation discusses why the graph approach is useful for multi-INT analysis, demonstrates Linkurious Enterprise with examples of tax evasion and corruption, and shows how the intelligence analysis team at AEI uses it to gain insights from disparate data.Webinar: What's new in Linkurious Enterprise 2.8
Webinar: What's new in Linkurious Enterprise 2.8Linkurious
Ěý
With Linkurious Enterprise 2.8, we focused on time filtering with a Timeline and on providing more control on data entry and data presentation with support for data schema.
We discuss:
- The benefits of a schema and how to set it up.
- How to explore and filter the graph over time using the Timeline.
- How to disable the auto-save mode.
We also discuss the changes in the graph layout menu.Graph-based intelligence analysis 
Graph-based intelligence analysis Linkurious
Ěý
For decades, the intelligence community has been collecting and analyzing information to produce timely and actionable insights for intelligence consumers. But as the amount of information collected increases, analysts are facing new challenges in terms of data processing and analysis. In this presentation, we explore the possibilities that graph technology is offering for intelligence analysis.What's new in Linkurious Enterprise 2.7
What's new in Linkurious Enterprise 2.7Linkurious
Ěý
The slides from a presentation of Linkurious Enterprise, in which we look at what’s new in this release, including the new Query Template capabilities and the redesign of the query panel.
Video of the presentation: https://youtu.be/ucuntmqzTYIHow to visualize Cosmos DB graph data
How to visualize Cosmos DB graph dataLinkurious
Ěý
Linkurious Enterprise is compatible with Azure Cosmos DB and offers investigation teams a turnkey solution to detect and investigate threats hidden in graph data. In this post, we explain how Linkurious Enterprise connects to Cosmos DB graph database.GraphTech Ecosystem - part 3: Graph Visualization
GraphTech Ecosystem - part 3: Graph VisualizationLinkurious
Ěý
The graph ecosystem presentation lists and introduces the graph visualization actors: graph visualization libraries and toolkits; graph visualizers and add-onsGetting started with Cosmos DB + Linkurious Enterprise
Getting started with Cosmos DB + Linkurious EnterpriseLinkurious
Ěý
Nowadays, many real-world applications generate data that is naturally connected, but traditional systems fail to capture the value it represents. Thanks to its graph API, the multi-model database Cosmos DB lets you model and store graph-like data. On top of Cosmos DB, Linkurious Enterprise is turnkey solution to detect and investigate insights through an interface for graph data visualization and analysis.
In this presentation, we will explain the value of graphs and show how to get started with Cosmos DB and Linkurious Enterprise to accelerate the discovery of new insights in your connected data. GraphTech Ecosystem - part 2: Graph Analytics
GraphTech Ecosystem - part 2: Graph AnalyticsLinkurious
Ěý
The graph ecosystem presentation lists and introduces a vast majority of graph analytics actors: graph analytics frameworks; graph processing engines; graph analytics libraries and toolkits; graph query languages and projects.GraphTech Ecosystem - part 1: Graph Databases
GraphTech Ecosystem - part 1: Graph DatabasesLinkurious
Ěý
The graph ecosystem presentation lists and introduces a vast majority of storage systems for graph-like data: native graph databases, RDF databases, multi-model systems or systems with a graph API. 3 types of fraud graph analytics can help defeat
3 types of fraud graph analytics can help defeatLinkurious
Ěý
Organizations across industries are adopting graph analytics to reinforce their anti-fraud programs. In this presentation, we examine three types of fraud graph analytics can help investigators combat. Blog post: https://linkurio.us/blog/3-fraud-graph-analytics-help-defeat/ Graph analytics in Linkurious Enterprise
Graph analytics in Linkurious EnterpriseLinkurious
Ěý
Graph algorithms provide tools to extract insights from graph data. From detecting anomalies to understanding what are the key elements in a network or finding communities, graph algorithms reveal information that would otherwise remain hidden. Learn about:
- The most popular graph algorithms and what they can be used for;
- The benefits of using graph analytics with Linkurious Enterprise;
- How to integrate graph analytics in Linkurious Enterprise.
Graph technology and data-journalism: the case of the Paradise Papers
Graph technology and data-journalism: the case of the Paradise PapersLinkurious
Ěý
Discover how graph analysis and visualization technologies allowed the ICIJ journalists to highlight the suspicious relations between political figures and offshore companies in the Paradise Papers investigations. Visualize the Knowledge Graph and Unleash Your Data
Visualize the Knowledge Graph and Unleash Your DataLinkurious
Ěý
şÝşÝߣs from the webinar "Visualize the Knowledge Graph and Unleash Your Data" with Michael Grove, Vice President of Engineering and co-founder of Stardog, and Jean Villedieu, co-founder of Linkurious.
The webinar covers the topic of enterprise Knowledge Graphs and lets you experience how to visualize and analyze this data to discover actionable insights for your organization. Graph-based Product Lifecycle Management
Graph-based Product Lifecycle ManagementLinkurious
Ěý
Supporting product development while reducing material and prototyping costs or centralizing product records is critical for PLM and PDM managers. However, the growing complexity and volume of cross-business data and processes can turn the management of a product lifecycle into a complex enterprise.
Graph technology like Linkurious offers an intuitive approach to model, search and understand data by putting the connections between components at the forefront. Modeling people, processes, business systems and products components into an interactive and unified network is one of the keys to escape the complexity of product development and find the insights your organization need to gain competitive advantage.
In this presentation, you will learn about:
- Challenges and risks of product development and data management,
- How businesses can use graph technology to model, visualize, optimize and monitor product lifecycles and related elements,
- How to conduct BOM and change management with Linkurious.Fraudes Financières: Méthodes de Prévention et Détection
Fraudes Financières: Méthodes de Prévention et DétectionLinkurious
Ěý
Cette présentation en partenariat avec DataStax revient sur comment détecter en temps réel des activités frauduleuses telles que la fraude identitaire. Des applications concrètes de ces technologies seront détaillées, de l’affaire des Panama Papers à des cas d’usages quotidiens dans des banques et des institutions financières. Les techniques de lutte antifraude ainsi que les avantages des approches orientées graphe seront également présentés.Detecting eCommerce Fraud with Neo4j and Linkurious
Detecting eCommerce Fraud with Neo4j and LinkuriousLinkurious
Ěý
Last year, the global eCommerce market represented $1.9 trillions. As the market expands worldwide, the opportunity for fraud keeps growing with fraudsters constantly refining their tactics to outsmart anti-fraud frameworks. From chargeback fraud to re-shipping scam or identity fraud, numerous types of fraud can impact your organization. While collecting data is essential to enable real-time risk assessment, many organizations don’t have the necessary tools to find the insights needed to block fraud attempts.
Neo4j and Linkurious offer a solution to tackle the eCommerce fraud challenge. Their combined technologies provide a 360° overview of organization’s data and allow real-time analysis and detection of eCommerce fraud patterns and activities.More Related Content
Viewers also liked (6)
Linkurious Enterprise: graph visualization platform neo4j
Linkurious Enterprise: graph visualization platform neo4jLinkurious
Ěý
Linkurious is a French startup founded in 2013 that provides the first graph visualization platform for Neo4j. It allows users to easily visualize and explore graph data stored in Neo4j to accelerate analysis and improve decision making. Linkurious offers starter, enterprise, and toolkit pricing plans starting at 990 euros per user per year for basic search and exploration of data.GraphX and Pregel - Apache Spark
GraphX and Pregel - Apache SparkAshutosh Trivedi
Ěý
A nice use case of GraphX of Apache Spark in solving Feedback Vertex Set. Pregel usecase in Geographical Systems.Building a Graph of all US Businesses Using Spark Technologies by Alexis Roos
Building a Graph of all US Businesses Using Spark Technologies by Alexis RoosSpark Summit
Ěý
This document discusses building a graph of U.S. businesses using Spark technologies. It describes how Radius Intelligence builds a comprehensive business graph from multiple data sources by acquiring and preparing raw data, clustering records, and constructing the graph by linking business and location vertices and attributes through techniques like connected components analysis. Key lessons learned include that GraphX scales well, graph construction and updates are easy using RDD operations, and connected components analysis is an expensive graph operation.Using graph technologies to fight fraud
Using graph technologies to fight fraudLinkurious
Ěý
Learn how to use graph technologies to fight fraud. Combine the power of the Neo4j graph database with an easy to use graph visualization tool.Business Intelligence Presentation (1/2)
Business Intelligence Presentation (1/2)Bernardo Najlis
Ěý
Business Intelligence made easy! This is the first part of a two-part presentation I prepared for one of our customers to help them understand what Business Intelligence is and what can it do...Business intelligence ppt
Business intelligence pptsujithkylm007
Ěý
Business intelligence (BI) provides processes, technologies, and tools to help organizations analyze data and make better business decisions. BI technologies gather, store, analyze and provide access to enterprise data. This helps users understand what happened in the past, what is happening currently, and make plans to achieve desired future outcomes. BI provides a single point of access to information, timely answers to business questions, and allows all departments to use data for decision making. Key BI tools include dashboards, key performance indicators, graphical reporting, forecasting, and data visualization. These tools help analyze trends, customer behavior, market conditions, and support risk analysis and decision making.More from Linkurious (20)
Using graph technology for multi-INT investigations
Using graph technology for multi-INT investigationsLinkurious
Ěý
Linkurious is a graph analysis software that helps organizations identify insights hidden in complex data by providing a unified view of information from different sources and enabling new analytical capabilities. It breaks down data silos and reduces complexity for multi-INT (intelligence integration) investigations. The presentation discusses why the graph approach is useful for multi-INT analysis, demonstrates Linkurious Enterprise with examples of tax evasion and corruption, and shows how the intelligence analysis team at AEI uses it to gain insights from disparate data.Webinar: What's new in Linkurious Enterprise 2.8
Webinar: What's new in Linkurious Enterprise 2.8Linkurious
Ěý
With Linkurious Enterprise 2.8, we focused on time filtering with a Timeline and on providing more control on data entry and data presentation with support for data schema.
We discuss:
- The benefits of a schema and how to set it up.
- How to explore and filter the graph over time using the Timeline.
- How to disable the auto-save mode.
We also discuss the changes in the graph layout menu.Graph-based intelligence analysis
Graph-based intelligence analysis Linkurious
Ěý
For decades, the intelligence community has been collecting and analyzing information to produce timely and actionable insights for intelligence consumers. But as the amount of information collected increases, analysts are facing new challenges in terms of data processing and analysis. In this presentation, we explore the possibilities that graph technology is offering for intelligence analysis.What's new in Linkurious Enterprise 2.7
What's new in Linkurious Enterprise 2.7Linkurious
Ěý
The slides from a presentation of Linkurious Enterprise, in which we look at what’s new in this release, including the new Query Template capabilities and the redesign of the query panel.
Video of the presentation: https://youtu.be/ucuntmqzTYIHow to visualize Cosmos DB graph data
How to visualize Cosmos DB graph dataLinkurious
Ěý
Linkurious Enterprise is compatible with Azure Cosmos DB and offers investigation teams a turnkey solution to detect and investigate threats hidden in graph data. In this post, we explain how Linkurious Enterprise connects to Cosmos DB graph database.GraphTech Ecosystem - part 3: Graph Visualization
GraphTech Ecosystem - part 3: Graph VisualizationLinkurious
Ěý
The graph ecosystem presentation lists and introduces the graph visualization actors: graph visualization libraries and toolkits; graph visualizers and add-onsGetting started with Cosmos DB + Linkurious Enterprise
Getting started with Cosmos DB + Linkurious EnterpriseLinkurious
Ěý
Nowadays, many real-world applications generate data that is naturally connected, but traditional systems fail to capture the value it represents. Thanks to its graph API, the multi-model database Cosmos DB lets you model and store graph-like data. On top of Cosmos DB, Linkurious Enterprise is turnkey solution to detect and investigate insights through an interface for graph data visualization and analysis.
In this presentation, we will explain the value of graphs and show how to get started with Cosmos DB and Linkurious Enterprise to accelerate the discovery of new insights in your connected data. GraphTech Ecosystem - part 2: Graph Analytics
GraphTech Ecosystem - part 2: Graph AnalyticsLinkurious
Ěý
The graph ecosystem presentation lists and introduces a vast majority of graph analytics actors: graph analytics frameworks; graph processing engines; graph analytics libraries and toolkits; graph query languages and projects.GraphTech Ecosystem - part 1: Graph Databases
GraphTech Ecosystem - part 1: Graph DatabasesLinkurious
Ěý
The graph ecosystem presentation lists and introduces a vast majority of storage systems for graph-like data: native graph databases, RDF databases, multi-model systems or systems with a graph API. 3 types of fraud graph analytics can help defeat
3 types of fraud graph analytics can help defeatLinkurious
Ěý
Organizations across industries are adopting graph analytics to reinforce their anti-fraud programs. In this presentation, we examine three types of fraud graph analytics can help investigators combat. Blog post: https://linkurio.us/blog/3-fraud-graph-analytics-help-defeat/ Graph analytics in Linkurious Enterprise
Graph analytics in Linkurious EnterpriseLinkurious
Ěý
Graph algorithms provide tools to extract insights from graph data. From detecting anomalies to understanding what are the key elements in a network or finding communities, graph algorithms reveal information that would otherwise remain hidden. Learn about:
- The most popular graph algorithms and what they can be used for;
- The benefits of using graph analytics with Linkurious Enterprise;
- How to integrate graph analytics in Linkurious Enterprise.
Graph technology and data-journalism: the case of the Paradise Papers
Graph technology and data-journalism: the case of the Paradise PapersLinkurious
Ěý
Discover how graph analysis and visualization technologies allowed the ICIJ journalists to highlight the suspicious relations between political figures and offshore companies in the Paradise Papers investigations. Visualize the Knowledge Graph and Unleash Your Data
Visualize the Knowledge Graph and Unleash Your DataLinkurious
Ěý
şÝşÝߣs from the webinar "Visualize the Knowledge Graph and Unleash Your Data" with Michael Grove, Vice President of Engineering and co-founder of Stardog, and Jean Villedieu, co-founder of Linkurious.
The webinar covers the topic of enterprise Knowledge Graphs and lets you experience how to visualize and analyze this data to discover actionable insights for your organization. Graph-based Product Lifecycle Management
Graph-based Product Lifecycle ManagementLinkurious
Ěý
Supporting product development while reducing material and prototyping costs or centralizing product records is critical for PLM and PDM managers. However, the growing complexity and volume of cross-business data and processes can turn the management of a product lifecycle into a complex enterprise.
Graph technology like Linkurious offers an intuitive approach to model, search and understand data by putting the connections between components at the forefront. Modeling people, processes, business systems and products components into an interactive and unified network is one of the keys to escape the complexity of product development and find the insights your organization need to gain competitive advantage.
In this presentation, you will learn about:
- Challenges and risks of product development and data management,
- How businesses can use graph technology to model, visualize, optimize and monitor product lifecycles and related elements,
- How to conduct BOM and change management with Linkurious.Fraudes Financières: Méthodes de Prévention et Détection
Fraudes Financières: Méthodes de Prévention et DétectionLinkurious
Ěý
Cette présentation en partenariat avec DataStax revient sur comment détecter en temps réel des activités frauduleuses telles que la fraude identitaire. Des applications concrètes de ces technologies seront détaillées, de l’affaire des Panama Papers à des cas d’usages quotidiens dans des banques et des institutions financières. Les techniques de lutte antifraude ainsi que les avantages des approches orientées graphe seront également présentés.Detecting eCommerce Fraud with Neo4j and Linkurious
Detecting eCommerce Fraud with Neo4j and LinkuriousLinkurious
Ěý
Last year, the global eCommerce market represented $1.9 trillions. As the market expands worldwide, the opportunity for fraud keeps growing with fraudsters constantly refining their tactics to outsmart anti-fraud frameworks. From chargeback fraud to re-shipping scam or identity fraud, numerous types of fraud can impact your organization. While collecting data is essential to enable real-time risk assessment, many organizations don’t have the necessary tools to find the insights needed to block fraud attempts.
Neo4j and Linkurious offer a solution to tackle the eCommerce fraud challenge. Their combined technologies provide a 360° overview of organization’s data and allow real-time analysis and detection of eCommerce fraud patterns and activities.Graph-based Network & IT Management.
Graph-based Network & IT Management.Linkurious
Ěý
Graph-based Network & IT Management.
Linkurious is a graph visualization and analysis startup founded in 2013 in Paris that helps customers unlock insights from graph data. Their software helps visualize interconnected IT infrastructure components and detect issues by analyzing relationships and patterns in real-time. Linkurious supports graph databases like Neo4j, DataStax, Titan and AllegroGraph and is used by organizations for tasks like cybersecurity monitoring, IT operations management, and enterprise architecture planning.Graph-powered data lineage in Finance
Graph-powered data lineage in FinanceLinkurious
Ěý
şÝşÝߣs of Linkurious presentation at GraphConnect London 2017.
Tracking the flow of data is the foundation for solid data governance. It's also a compliance imperative for financial institutions impacted by BCBS 239. In this talk, we will discuss how graph-oriented data lineage is well suited for today's growing data volume and complexity. You will learn how to answer questions like: What would be the impact of a component of my data pipeline breaking up? Where does the data from a particular report originate?Using Linkurious in your Enterprise Architecture projects
Using Linkurious in your Enterprise Architecture projectsLinkurious
Ěý
1) Linkurious is a graph visualization and analysis startup that helps customers understand complex connected data through its graph database and visualization tools. 2) Enterprise architects use Linkurious to model enterprise architecture data as a graph with various entity types and relationships in order to better understand interdependencies and perform impact analysis across business, data, applications and technology. 3) Linkurious allows architects to intuitively investigate architecture overviews, generate custom reports, and collaborate more effectively on enterprise architecture projects.Visualizing an anti-money laundering investigation
Visualizing an anti-money laundering investigationLinkurious
Ěý
This document describes how graph visualization can help anti-money laundering investigators map out complex money laundering schemes. It presents a hypothetical example of an investigation into a drug organization, showing how the investigators were able to use financial records and Linkurious software to visualize the connections between companies, bank accounts, and individuals involved in a three-layer money laundering network. By exploring and editing the graph, they traced the flow of money through various entities until ultimately identifying the leaders of the criminal organization behind the scheme. The document argues that graph visualization allows investigators to more easily track relationships, find hidden connections in the data, and communicate their findings to others.Recently uploaded (14)
cyber hacking and cyber fraud by internet online money
cyber hacking and cyber fraud by internet online moneyVEENAKSHI PATHAK
Ěý
Cyber fraud is a blanket term to describe crimes committed by cyberattacks via the internet. These crimes are committed with the intent to illegally acquire and leverage an individual's or business’s sensitive information for monetary gain10 Critical Skills Kids Need in the AI Era
10 Critical Skills Kids Need in the AI EraRachelDines1
Ěý
What skills do the next generation need to thrive in the age of AI? Exploring the benefits of AI and the potential risks when it comes to the next generation.A Teaching Guide for Those interested in teaching monkey beach
A Teaching Guide for Those interested in teaching monkey beachsethiserena
Ěý
A Teaching Guide for Those interested in teaching monkey beachBuilding a Multiplatform SDKMAN in JavaFX.pdf
Building a Multiplatform SDKMAN in JavaFX.pdfJago de Vreede
Ěý
SDKMAN is one of the most popular ways to install/upgrade Java or other build tooling on your system. It works great from the command line, but what if you could bring its power to a graphical interface? And what if it worked seamlessly on Windows too? In this talk, we will use SDKMAN as an example of how to build a multiplatform native application using JavaFX for the UI and GraalVM to compile native images. We will dive into the process of creating native apps with GraalVM, distributing them with GitHub, and identifying some limitations of native Java applications. Plus, we’ll explore alternative methods for shipping native apps across platforms. By the end of this session, you will have practical insights on how to build and distribute native apps with or without JavaFX.Hygiene-and-Sanitation with healthcare and the most important hygiene to be
Hygiene-and-Sanitation with healthcare and the most important hygiene to beLoveJade1
Ěý
Hygiene and sanitation 3d animation3d animation3d animation3d animation
3d animation3d animation3d animation3d animationanimationkeemo21
Ěý
3d animation 3d animation3d animation 3d animation 3d animation 3d animation 
RIRs and the Next Chapter of Internet Growth - from IPv4 to IPv6
RIRs and the Next Chapter of Internet Growth - from IPv4 to IPv6APNIC
Ěý
Subha Shamarukh, Internet Resource Analyst at APNIC, presented on 'RIRs and the Next Chapter of Internet Growth - from IPv4 to IPv6' at the Bangladesh Internet Governance Forum held in Dhaka on 29 January 2025.
What Is the Difference Between the Internet and WAN.pdf
What Is the Difference Between the Internet and WAN.pdfInternet Bundle Now
Ěý
Learn the key differences between the Internet and WAN. Understand how high Internet plans and private networks can serve different purposes for businesses.
Shopify API Integration for Custom Analytics_ Advanced Metrics & Reporting Gu...
Shopify API Integration for Custom Analytics_ Advanced Metrics & Reporting Gu...CartCoders
Ěý
CartCoders offers specialized Shopify integration services to enhance your eCommerce store's functionality and user experience. Connect your Shopify store seamlessly with essential software and applications. Perfect for businesses aiming to streamline operations and boost efficiency.JACKPOT TANGKI4D BERMAIN MENGGUNAKAN ID PRO 2025 TEPERCAYA LISENSI STAR GAMIN...
JACKPOT TANGKI4D BERMAIN MENGGUNAKAN ID PRO 2025 TEPERCAYA LISENSI STAR GAMIN...TANGKI4D
Ěý
MODAL 50RIBU JACKPOT 10JUTA
BERMAIN DI STARLIGHT PRINCESS
TUNGGU APA LAGI MAIN KAN SEKARANG
GUNAKAN POLA BERMAIN REKOMENDASI KAMI
3x MANUAL SPIN ❎❎✅ DC ON-OFF
10x TURBO Spin ✅❎ ✅ DC OFF
2x MANUAL Spin ✅❎✅ DC ON-OFF
20x CEPAT Spin ❎✅✅ DC OFF
COMBO DENGAN BUY FITURE SPIN
#Tangki4dexclusive #tangki4dlink #tangki4dvip #bandarsbobet #idpro2025 #stargamingasia #situsjitu #jppragmaticplayAPNIC Update, presented by Joyce Chen at APTLD 87
APNIC Update, presented by Joyce Chen at APTLD 87APNIC
Ěý
Joyce Chen, Senior Advisor - Strategic Engagement at APNIC presented the APNIC Update at APTLD 87 held from 10 to 13 February 2025 in Hong Kong. ![phase_4_presentation[1] - Read-Only.pptx Iot](https://cdn.slidesharecdn.com/ss_thumbnails/phase4presentation1-read-only-250301195122-ec11f187-thumbnail.jpg?width=560&fit=bounds)
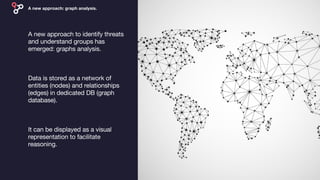
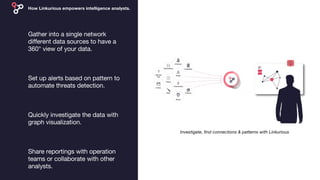
Using graphs technologies for intelligence analysis.
- 23. Bibliography : â—Ź Central Intelligence Agency. Issues for the US Intelligence Community. Available: â—Ź â—Ź â—Ź â—Ź Thinkstock