Venture Capital - Innovation, Market Sizing
- 1. Wearable Technology ŌĆō Smart Fit (Concept) Richard Chan ŌĆō Nicholas Kouyialis - Jillian Nguyen - Doohan Yoon -
- 3. Product
- 4. Industry: Total Wearable Market
- 5. Industry: Market Drivers ŌĆō Fitness Monitoring
- 7. Industry: Competitive Landscape Ease of Use, Comfort (+) Device-Based Seamless Ease of Use, Comfort (-) SmartFit
- 8. Marketing ’üĄ Price ’üĄ2% royalty fee ’üĄInitial Short Term Contract ’üĄ Place ’üĄDirect to predominate sport clothing companies ’üĄ Promotion ’üĄElectronic and fitness conventions
- 9. Operation/Development Month 1 Month 2 Month 3 Month 4 Month 5 Month 6 Month 7 Month 8 Month 9 Month 10 Month 11 Month 12 Idea Capturing/Screening Finalize Plan/Business Case Product Design Development Testing Integration User Experience Evaluation Web Design/Maintenance Sales & Marketing Business Plan alignment Check Manage Budget/Funding Launch
- 10. Financials ŌĆō 5 Year Sales/EBITDA ($000) (260.0) 828.8 4,176.5 9,489.0 20,421.9 0.0 1,840.5 5,567.8 11,224.4 22,626.7 (5,000.0) 0.0 5,000.0 10,000.0 15,000.0 20,000.0 25,000.0 2014 2015 2016 2017 2018 Sales EBITDA
- 11. Offering/Use of Proceeds Salaries- R&D 46% Lab Materials 14% Lawyer/Patent Fees 14% Equipment 14% Buffer 12% $350K for 20% Equity Stake
- 12. Team Background ŌĆō Real Industry Experience Head of Tech Head Scientist/Board Advisor Head of Finance Head of Sales/Marketing
- 13. Questions?
- 14. Appendix
- 16. Critical Risks Risk Type Details Risk Magnitude Risk Probability Market Risks that customers wonŌĆÖt buy the intended product or service There may not be enough early adopters and customer volumes to support sales forecasts 30% Technology Risk that product and service canŌĆÖt be built as intended This is a fairly new type of technology in the marketplace, there could be limits to desired functionality 40% Executional Complexity of Operations Due to complexity schedule may not execute as planned 30% Overall Risk Rating 33%
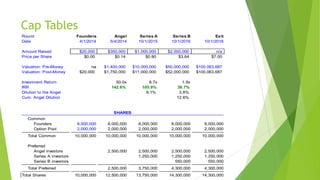
- 17. Cap Tables Round Founders Angel Series A Series B Exit Date 4/1/2014 5/4/2014 10/1/2015 10/1/2016 10/1/2018 Amount Raised $20,000 $350,000 $1,000,000 $2,000,000 n/a Price per Share $0.00 $0.14 $0.80 $3.64 $7.00 Valuation: Pre-Money na $1,400,000 $10,000,000 $50,000,000 $100,063,687 Valuation: Post-Money $20,000 $1,750,000 $11,000,000 $52,000,000 $100,063,687 Investment Return 50.0x 8.7x 1.9x IRR 142.6% 105.9% 38.7% Dilution to the Angel 9.1% 3.8% Cum. Angel Dilution 12.6% SHARES Common Founders 8,000,000 8,000,000 8,000,000 8,000,000 8,000,000 Option Pool 2,000,000 2,000,000 2,000,000 2,000,000 2,000,000 Total Common 10,000,000 10,000,000 10,000,000 10,000,000 10,000,000 Preferred Angel investors 2,500,000 2,500,000 2,500,000 2,500,000 Series A investors 1,250,000 1,250,000 1,250,000 Series B investors 550,000 550,000 Total Preferred 2,500,000 3,750,000 4,300,000 4,300,000 Total Shares 10,000,000 12,500,000 13,750,000 14,300,000 14,300,000
- 18. Multiples $(millions) Price Shares Debt Cash EV Rev EBITDA EBIT FCF Under Armour 101.9 105.8 152.9 347.5 10,587.4 2,332.1 318.2 265.1 32.0 Nike 71.3 881.0 1,388.0 3,337.0 60,822.3 25,313.0 3,610.0 3,254.0 2,391.0 Multiples Rev EBITDA EBIT FCF Under Armour 4.5 33.3 39.9 330.9 Nike 2.4 16.8 18.7 25.4 Average 3.5 25.1 29.3 178.1 Smart Fit 22.6 20.4 20.4 12.8 Multiple Calc 78.5 511.8 596.7 2,288.0 Less Debt Plus Cash 21.5 21.5 21.5 21.5 Fair Value 100.1 533.4 618.3 2,309.5 2,309.5m 890.3m Blend of all 4 Multiples Min Value 100.1m Max Value
- 19. IS/DCF Potential Price in thousands ($000) 2014 2015 2016 2017 2018 Assumption Total Revenue -$ 1,841$ 5,568$ 11,224$ 22,627$ 23,984$ % growth rate 202.5% 101.6% 101.6% 6.0% - COGS -$ -$ -$ -$ -$ -$ % of revenue 0.0% 0.0% 0.0% 0.0% 0.0% 0.0% Gross Profit -$ 1,841$ 5,568$ 11,224$ 22,627$ 23,984$ % of revenue #DIV/0! 100.0% 100.0% 100.0% 100.0% 100.0% - Operating Exp 260$ 1,012$ 1,391$ 1,735$ 2,205$ 2,337$ % of revenue #DIV/0! 55.0% 25.0% 15.5% 9.7% 9.7% - SG&A (Op Ex) Totals 260$ 1,012$ 1,391$ 1,735$ 2,205$ 2,337$ % of revenue #DIV/0! 55.0% 25.0% 15.5% 9.7% 9.7% EBITDA (260)$ 829$ 4,177$ 9,489$ 20,422$ 21,647$ % of revenue #DIV/0! 45.0% 75.0% 84.5% 90.3% 90.3% - D & A (Op Ex) 3$ 13$ 26$ 43$ 66$ 69$ % of revenue #DIV/0! 0.7% 0.5% 0.4% 0.3% 0.3% EBIT (oper profits) (263)$ 816$ 4,151$ 9,446$ 20,356$ 21,578$ % of revenue #DIV/0! 44.4% 74.6% 84.2% 90.0% 90.0% - Taxes (92)$ 286$ 1,453$ 3,306$ 7,125$ 7,552$ % of EBIT 35.0% 35.0% 35.0% 35.0% 35.0% 35.0% NOPAT (171)$ 531$ 2,698$ 6,140$ 13,232$ 14,026$ % of revenue #DIV/0! 28.8% 48.5% 54.7% 58.5% 58.5% 47.6m$ Best View Estimates Industry WACC 30.0% LTG (est) 6.0%


