Veteran Employment Stats
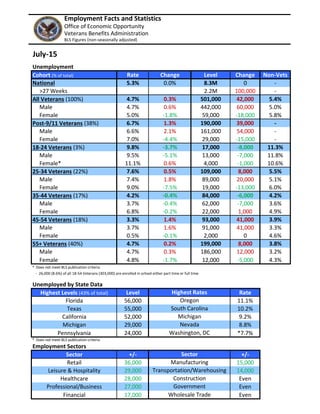
- 1. Employment Facts and Statistics Office of Economic Opportunity Veterans Benefits Administration BLS Figures (non-seasonally adjusted) July-15 Unemployment Cohort (% of total) Rate Change Level Change Non-Vets National 5.3% 0.0% 8.3M 0 - >27 Weeks 2.2M 100,000 - All Veterans (100%) 4.7% 0.3% 501,000 42,000 5.4% Male 4.7% 0.6% 442,000 60,000 5.0% Female 5.0% -1.8% 59,000 -18,000 5.8% Post-9/11 Veterans (38%) 6.7% 1.3% 190,000 39,000 - Male 6.6% 2.1% 161,000 54,000 - Female 7.0% -4.4% 29,000 -15,000 - 18-24 Veterans (3%) 9.8% -3.7% 17,000 -8,000 11.3% Male 9.5% -5.1% 13,000 -7,000 11.8% Female* 11.1% 0.6% 4,000 -1,000 10.6% 25-34 Veterans (22%) 7.6% 0.5% 109,000 8,000 5.5% Male 7.4% 1.8% 89,000 20,000 5.1% Female 9.0% -7.5% 19,000 -13,000 6.0% 35-44 Veterans (17%) 4.2% -0.4% 84,000 -6,000 4.2% Male 3.7% -0.4% 62,000 -7,000 3.6% Female 6.8% -0.2% 22,000 1,000 4.9% 45-54 Veterans (18%) 3.3% 1.4% 93,000 41,000 3.9% Male 3.7% 1.6% 91,000 41,000 3.3% Female 0.5% -0.1% 2,000 0 4.6% 55+ Veterans (40%) 4.7% 0.2% 199,000 8,000 3.8% Male 4.7% 0.3% 186,000 12,000 3.2% Female 4.8% -1.7% 12,000 -5,000 4.3% * Does not meet BLS publication criteria - 26,000 (8.6%) of all 18-54 Veterans (303,000) are enrolled in school either part time or full time Unemployed by State Data Highest Levels (43% of total) Level Rate Florida 56,000 11.1% Texas 55,000 10.2% California 52,000 9.2% Michigan 29,000 8.8% Pennsylvania 24,000 *7.7% * Does not meet BLS publication criteria Employment Sectors Sector +/- +/- Retail 36,000 15,000 Leisure & Hospitality 29,000 14,000 Healthcare 28,000 Even Professional/Business 27,000 Even Financial 17,000 Even Highest Rates Oregon South Carolina Government Wholesale Trade Construction Sector Manufacturing Transportation/Warehousing Michigan Nevada Washington, DC
- 2. Vets / Non-Vets Vets / Non-Vets 0% 10% 20% 30% 40% 18-24 yrs old 0% 5% 10% 15% 20% 25-34 0% 2% 4% 6% 8% 10% 35-44 0% 2% 4% 6% 8% 10% 45-54 0% 2% 4% 6% 8% 10% 12% Veterans vs Non-Veterans 0% 5% 10% 15% 20% 25% 30% 35% All Veterans Post-9/11 18-24 25-34 35-44 45-54 55+ Year-Over-Year Comparison Jul-11 Jul-12 Jul-13 Jul-14 Jul-15 0% 2% 4% 6% 8% 10% 55+


