際際滷

際際滷Share a Scribd company logo
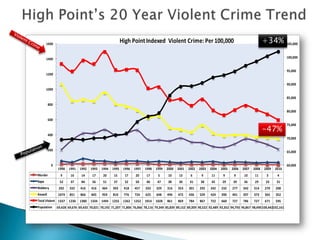
1990 1991 1992 1993 1994 1995 1996 1997 1998 1999 2000 2001 2002 2003 2004 2005 2006 2007 2008 2009 2010
Murder 9 16 14 17 20 15 17 20 17 5 10 13 6 9 11 9 9 10 11 3 4
Rape 52 37 84 56 51 37 52 50 40 47 38 30 41 38 45 29 39 36 29 33 31
Robbery 202 332 416 416 464 393 418 457 333 329 316 353 301 292 242 232 277 342 314 270 208
Assault 1074 851 866 845 959 810 776 724 625 648 496 472 436 529 424 390 401 397 373 365 352
Total Violent 1337 1236 1380 1334 1494 1255 1262 1252 1014 1028 861 869 784 867 722 660 727 786 727 671 595
Population 69,428 69,676 69,433 70,021 70,192 71,207 71,806 76,066 78,116 79,349 85,839 89,152 89,309 90,522 92,489 93,352 94,793 96,867 98,490 100,442102,161
60,000
65,000
70,000
75,000
80,000
85,000
90,000
95,000
100,000
105,000
0
200
400
600
800
1000
1200
1400
1600
High PointIndexed Violent Crime: Per 100,000
-47%
+34%
SOURCE: Heaton, Paul. RAND Economist Offers Evidence That Crime-Fighting Can Pay for Itself.
Violent Crime and the Economic Crisis: Police Chiefs Face A New Challenge. Critical Issues in
Policing Series Part II. Police Executive Research Forum, Washington May 2009: 22-23.
Crime
Miller,Cohen &
Weirsema (1996)
Cohen et al. (2004)
French, McCollister,
and Reznik (2007)
Average Cost of
Crime Using all 3
Studies
Murder $4,068,866 $11,608,317 $9,347,132 $8,000,000
Rape $117,997 $283,626 $219,933 $200,000
Robbery $17,632 $277,642 $51,134 $100,000
Assault $20, 344 $83,771 $123,162 $75,000
 VCTF and HPCAV formed 1997
 Since 1998 City has averaged 201 fewer violent crimes per year
 (murder, rape, robbery, assault)
 A total of 2,412 violent crimes prevented between1998-2009
 Cumulative total saved $484,572,000 based on RAND economist estimates
Crime
Average
prevented
per year
Social Cost
per crime
Total Savings
Murder 3 8,300,000 24,900,000
Rape 3 207,000 621,000
Robbery 4 115,000 460,000
Assault 192 75,000 14,400,000
Total for 1 year $40,381,000
http://www.cops.usdoj.gov/
http://www.ojp.usdoj.gov/nij/publications/http://www.ncjrs.gov/pdffiles/jr000236.pdf

More Related Content

Violence Prevention Impact - High Point Model

  • 1. 1990 1991 1992 1993 1994 1995 1996 1997 1998 1999 2000 2001 2002 2003 2004 2005 2006 2007 2008 2009 2010 Murder 9 16 14 17 20 15 17 20 17 5 10 13 6 9 11 9 9 10 11 3 4 Rape 52 37 84 56 51 37 52 50 40 47 38 30 41 38 45 29 39 36 29 33 31 Robbery 202 332 416 416 464 393 418 457 333 329 316 353 301 292 242 232 277 342 314 270 208 Assault 1074 851 866 845 959 810 776 724 625 648 496 472 436 529 424 390 401 397 373 365 352 Total Violent 1337 1236 1380 1334 1494 1255 1262 1252 1014 1028 861 869 784 867 722 660 727 786 727 671 595 Population 69,428 69,676 69,433 70,021 70,192 71,207 71,806 76,066 78,116 79,349 85,839 89,152 89,309 90,522 92,489 93,352 94,793 96,867 98,490 100,442102,161 60,000 65,000 70,000 75,000 80,000 85,000 90,000 95,000 100,000 105,000 0 200 400 600 800 1000 1200 1400 1600 High PointIndexed Violent Crime: Per 100,000 -47% +34%
  • 2. SOURCE: Heaton, Paul. RAND Economist Offers Evidence That Crime-Fighting Can Pay for Itself. Violent Crime and the Economic Crisis: Police Chiefs Face A New Challenge. Critical Issues in Policing Series Part II. Police Executive Research Forum, Washington May 2009: 22-23. Crime Miller,Cohen & Weirsema (1996) Cohen et al. (2004) French, McCollister, and Reznik (2007) Average Cost of Crime Using all 3 Studies Murder $4,068,866 $11,608,317 $9,347,132 $8,000,000 Rape $117,997 $283,626 $219,933 $200,000 Robbery $17,632 $277,642 $51,134 $100,000 Assault $20, 344 $83,771 $123,162 $75,000
  • 3. VCTF and HPCAV formed 1997 Since 1998 City has averaged 201 fewer violent crimes per year (murder, rape, robbery, assault) A total of 2,412 violent crimes prevented between1998-2009 Cumulative total saved $484,572,000 based on RAND economist estimates Crime Average prevented per year Social Cost per crime Total Savings Murder 3 8,300,000 24,900,000 Rape 3 207,000 621,000 Robbery 4 115,000 460,000 Assault 192 75,000 14,400,000 Total for 1 year $40,381,000