Visual Analytics with Tableau
- 1. www.edureka.co/data-visualization-with-tableau Visual Analytics with Tableau View Data Visualization with Tableau course details at www.edureka.co/data-visualization-with-tableau For Queries: Post on Twitter @edurekaIN: #askEdureka Post on Facebook /edurekaIN For more details please contact us: US : 1800 275 9730 (toll free) INDIA : +91 88808 62004 Email Us : sales@edureka.co
- 2. ║▌║▌▀Ż 2 www.edureka.co/data-visualization-with-tableau ’é« Direct connection with Statistical packages ’é« Splitting data columns ’é« All new Tableau Discover Side Menu ’é« Connecting to Data Source ’é« Dynamically Fast Tool Tip At the end of this session, you will be able to: Objectives
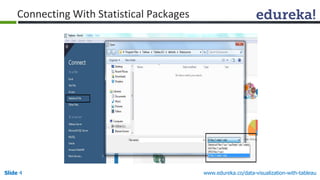
- 3. ║▌║▌▀Ż 3 www.edureka.co/data-visualization-with-tableau ’é«The new connector in Tableau 9.x brings native support for a number of statistical package files including: ŌĆó .sas7bdat ŌĆō the file format used by SAS ŌĆó .sav ŌĆō the binary file format used by SPSS ŌĆó .rdata, .rda ŌĆō the file formats employed by the R statistical analysis package Connecting With Statistical Packages
- 4. ║▌║▌▀Ż 4 www.edureka.co/data-visualization-with-tableau Connecting With Statistical Packages
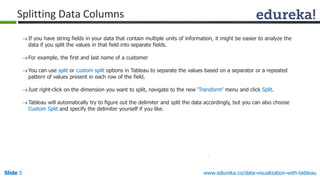
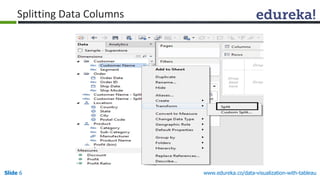
- 5. ║▌║▌▀Ż 5 www.edureka.co/data-visualization-with-tableau Splitting Data Columns ’é«If you have string fields in your data that contain multiple units of information, it might be easier to analyze the data if you split the values in that field into separate fields. ’é«For example, the first and last name of a customer ’é«You can use split or custom split options in Tableau to separate the values based on a separator or a repeated pattern of values present in each row of the field. ’é«Just right-click on the dimension you want to split, navigate to the new ŌĆśTransformŌĆÖ menu and click Split. ’é«Tableau will automatically try to figure out the delimiter and split the data accordingly, but you can also choose Custom Split and specify the delimiter yourself if you like.
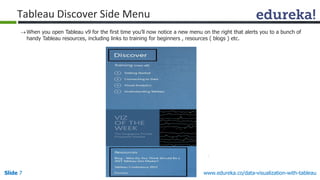
- 7. ║▌║▌▀Ż 7 www.edureka.co/data-visualization-with-tableau Tableau Discover Side Menu ’é«When you open Tableau v9 for the first time youŌĆÖll now notice a new menu on the right that alerts you to a bunch of handy Tableau resources, including links to training for beginners , resources ( blogs ) etc.
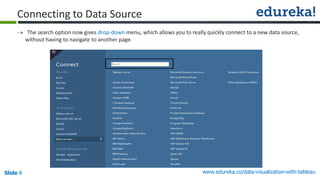
- 8. www.edureka.co/data-visualization-with-tableau║▌║▌▀Ż 8 Connecting to Data Source ’é« The search option now gives drop-down menu, which allows you to really quickly connect to a new data source, without having to navigate to another page.
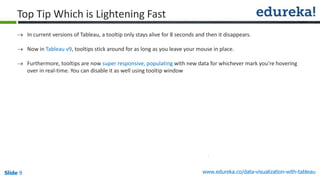
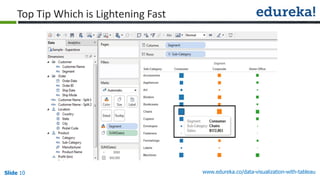
- 9. www.edureka.co/data-visualization-with-tableau║▌║▌▀Ż 9 Top Tip Which is Lightening Fast ’é« In current versions of Tableau, a tooltip only stays alive for 8 seconds and then it disappears. ’é« Now in Tableau v9, tooltips stick around for as long as you leave your mouse in place. ’é« Furthermore, tooltips are now super responsive, populating with new data for whichever mark youŌĆÖre hovering over in real-time. You can disable it as well using tooltip window
- 10. www.edureka.co/data-visualization-with-tableau║▌║▌▀Ż 10 Top Tip Which is Lightening Fast
- 12. ║▌║▌▀Ż 12 Course Url

