際際滷

際際滷Share a Scribd company logo
Visualization
Methods
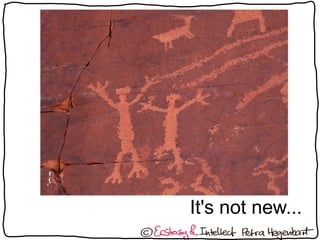
It's not new...
This is a text. It is a string of words that are put one
after another based on a system of rules called
grammar. As you read along you try to make sense of
what you read and you might make pictures in your
mind to remember what was being said at the
beginning and to figure out where this is all leading
to. If you have a short attention span, however, you
might have already forgotten what was said at the
beginning and you could also get lost in the details
and miss the complete picture. Besides, these black
marks on white paper look ... well, they look rather
dull. Because of this and for other reasons and to
make a long story short, we like to
visualize information
VISUALIZING INFORMATION BENEFITS:
 reveal the big picture AND the detail
 show relationships between the parts
 >literally< more exciting to our brain
VISUALIZING INFORMATION BENEFITS:
 reveal the big picture AND the detail
 show relationships between the parts
 >literally< more exciting to our brain
Mindmaps
 Probably one of the better
known tools
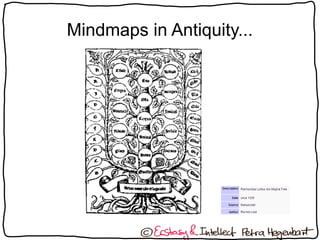
 Was used in antiquity already
but was made popular by Tony
Buzan in the 1970s
 Works really well to visualize
hierarchical structures or parts-
of-a-system overviews (eg.
Book contents, etc.)
Mindmaps in Antiquity...
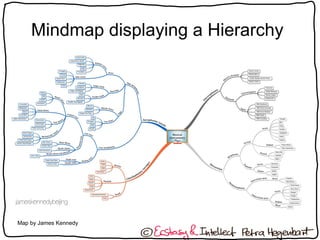
Mindmap displaying a Hierarchy
Map by James Kennedy
Concept Maps
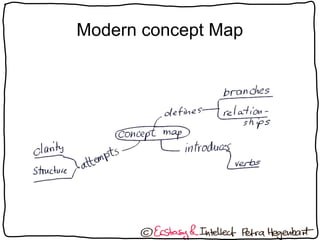
 If it is necessary to spell out the
relationships between the nodes
of a mindmap, you call it a
concept map
 Some mindmapping software
allows you to do that (eg.
TheBrain)
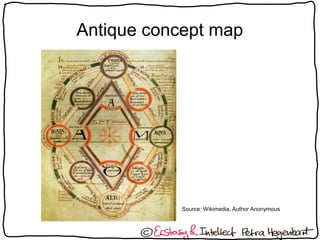
Antique concept map
Source: Wikimedia, Author Anonymous
Modern concept Map
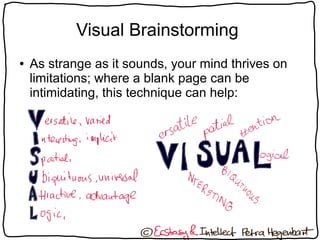
Visual Brainstorming
 As strange as it sounds, your mind thrives on
limitations; where a blank page can be
intimidating, this technique can help:
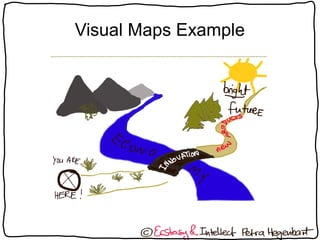
Visual Maps
 With the rise of Graphic Facilitation, there are
more and more visual map templates that
visually chunk information (eg. Business Model
canvas, etc.)
 Others use a metaphor to get people to
associate and create a story around their topics
Visual Maps Example
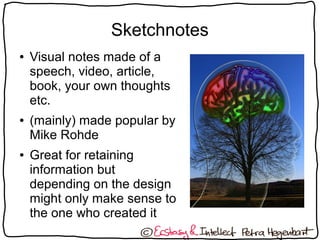
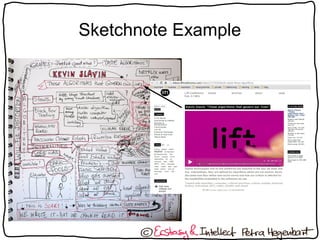
Sketchnotes
 Visual notes made of a
speech, video, article,
book, your own thoughts
etc.
 (mainly) made popular by
Mike Rohde
 Great for retaining
information but
depending on the design
might only make sense to
the one who created it
Sketchnote Example
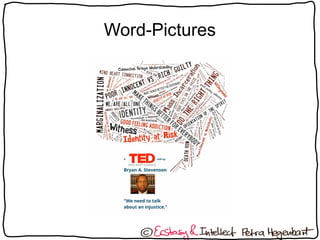
Word-Pictures
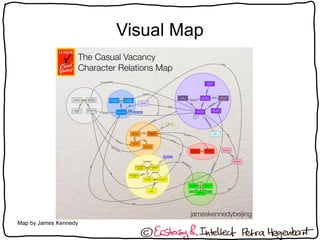
Visual Map
Map by James Kennedy
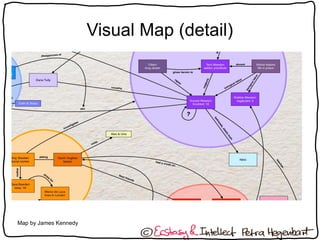
Visual Map (detail)
Map by James Kennedy
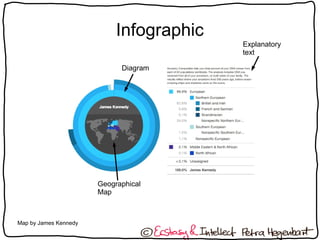
Infographic
Geographical
Map
Explanatory
text
Diagram
Map by James Kennedy
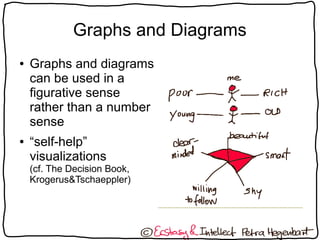
Graphs and Diagrams
 Graphs and diagrams
can be used in a
figurative sense
rather than a number
sense
 self-help
visualizations
(cf. The Decision Book,
Krogerus&Tschaeppler)
When to use what?
 Who is it for?
(Yourself or other people?)
 What is for?
(Purpose? Exploration, planning, retaining information, education,
persuasion, etc.)
Good questions to ask yourself about your
visualization:

How memorable is it?

How conclusive is it?
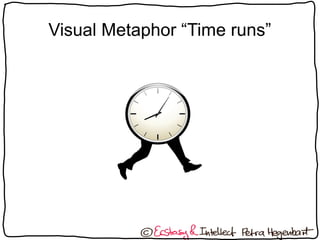
Visual Metaphor Time 姻顎稼壊

More Related Content

Visualization Methods

  • 3. This is a text. It is a string of words that are put one after another based on a system of rules called grammar. As you read along you try to make sense of what you read and you might make pictures in your mind to remember what was being said at the beginning and to figure out where this is all leading to. If you have a short attention span, however, you might have already forgotten what was said at the beginning and you could also get lost in the details and miss the complete picture. Besides, these black marks on white paper look ... well, they look rather dull. Because of this and for other reasons and to make a long story short, we like to visualize information
  • 4. This is a text. It is a string of words that are put one after another based on a system of rules called grammar. As you read along you try to make sense of what you read and you might make pictures in your mind to remember what was being said at the beginning and to figure out where this is all leading to. If you have a short attention span, however, you might have already forgotten what was said at the beginning and you could also get lost in the details and miss the complete picture. Besides, these black marks on white paper look ... well, they look rather dull. Because of this and for other reasons and to make a long story short, we like to visualize information VISUALIZING INFORMATION BENEFITS: reveal the big picture AND the detail show relationships between the parts >literally< more exciting to our brain VISUALIZING INFORMATION BENEFITS: reveal the big picture AND the detail show relationships between the parts >literally< more exciting to our brain
  • 5. Mindmaps Probably one of the better known tools Was used in antiquity already but was made popular by Tony Buzan in the 1970s Works really well to visualize hierarchical structures or parts- of-a-system overviews (eg. Book contents, etc.)
  • 7. Mindmap displaying a Hierarchy Map by James Kennedy
  • 8. Concept Maps If it is necessary to spell out the relationships between the nodes of a mindmap, you call it a concept map Some mindmapping software allows you to do that (eg. TheBrain)
  • 9. Antique concept map Source: Wikimedia, Author Anonymous
  • 11. Visual Brainstorming As strange as it sounds, your mind thrives on limitations; where a blank page can be intimidating, this technique can help:
  • 12. Visual Maps With the rise of Graphic Facilitation, there are more and more visual map templates that visually chunk information (eg. Business Model canvas, etc.) Others use a metaphor to get people to associate and create a story around their topics
  • 14. Sketchnotes Visual notes made of a speech, video, article, book, your own thoughts etc. (mainly) made popular by Mike Rohde Great for retaining information but depending on the design might only make sense to the one who created it
  • 17. Visual Map Map by James Kennedy
  • 18. Visual Map (detail) Map by James Kennedy
  • 20. Graphs and Diagrams Graphs and diagrams can be used in a figurative sense rather than a number sense self-help visualizations (cf. The Decision Book, Krogerus&Tschaeppler)
  • 21. When to use what? Who is it for? (Yourself or other people?) What is for? (Purpose? Exploration, planning, retaining information, education, persuasion, etc.) Good questions to ask yourself about your visualization: How memorable is it? How conclusive is it?
  • 22. Visual Metaphor Time 姻顎稼壊