Weather graphics
- 1. Graphic Weather Products & How to Read Them
- 2. Graphic Wx Products • Quickly access large-scale weather patterns • Identify trends • Predict wx that might occur over time • Identify areas of IFR wx at a glance • See where IFR conditions are forecast within the next 12-24 hours
- 3. Required Graphics • Surface Analysis Chart • Weather Depiction Chart • Radar Summary Chart • 12/24 Hour Significant Weather Prognostic Chart • Winds & Temps Aloft Chart
- 5. Surface Analysis • Depicts an analysis of the current surface weather • Computer prepared every 3 hours • Shows; o Areas of pressure o Fronts o Temperatures o Dew points o Wind Directions & Speeds o Local Weather o Visual Obstructions
- 6. Station Model • Created by computer • Mainly on surface- weather maps • Winds are true direction • Temp/Dew point is in Fahrenheit
- 7. So What Do I Need To Know? • A good source for general weather information over a wide area. • Depicts the actual position of fronts, pressure patterns, temperatures, dew point, wind, weather, and obstructions to vision at the valid time of the chart. • When the Isobars are close the pressure gradient is greater meaning wind velocities will be stronger. • Dashed lines indicate a weak pressure gradient.
- 9. Wx Depiction • Derived from METAR’s • Prepared every 3 hours beginning at 0100Z by a computer • Used for flight planning • Displays o Major fronts o Areas of pressure o Graphic display of IFR, MVFR, VFR o Shows a modified station model
- 10. Modified Station Model • Sky Conditions • Cloud height or ceiling • Weather • Obstructions to visibility • Same as Surface Analysis
- 11. So What Do I need To Know? • Some may be automated • Bases shown are the lowest layer
- 12. Radar Summary
- 13. Radar Summary (SD) • Computer generated • Published hourly, 35 minutes past the hour • Displays areas of precipitation as well as the characteristics of the precipitation.
- 14. SD • NA – No information Available • NE – No echoes • Height of tops in hundreds of feet MSL • Movement of cells depicted by arrow
- 15. So What Do I Need To Know? • The only charts that show lines and cells of thunderstorms • You can determine the tops and bases of echoes, the intensity of the precipitation, and the echo movement. • Most effective when used in combination with other charts, reports, and forecasts.
- 20. Composite Moisture Stability Chart • Four Panels showing stability, precipitable water, freezing level, & average relative humidity conditions. • Computer generated • Obtained from upper air observations • Updated twice daily • Stability = Potential for thunderstorms • You will not find this chart anywhere in the current system
- 21. Constant Pressure Analysis Chart
- 22. Composite Moisture Stability Chart
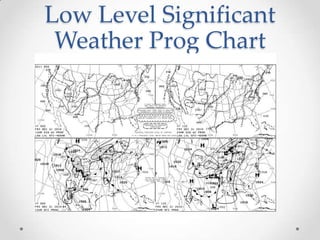
- 23. Low Level Significant Weather Prog Chart
- 24. Prog Charts • SFC to FL240 (400 Millibar) • 12/24 hour forecast, and 36/48 forecast • Issued four times daily • Valid time is printed on it
- 25. Prog Charts Upper Panels Lower Panels • Shows forecasted • Forecast surface wx significant weather o Pressure systems o Non-convective turbulence o Fronts (dashed lines) o Precipitation o Freezing levels (zigzag lines) o IFR (solid lines) o MVFR (scalloped lines)
- 26. High-Level Significant Weather Prog Chart Issued 4 times a day
- 27. High level Prog • Domestic & International Flights • FL240 – FL600 • Presents a forecast for; o Thunderstorms o Tropical cyclones o Squall Lines o Moderate or greater turbulence o Wide spread dust storms & sandstorms o Tropopause height o Location of jet streams o Volcanic activity
- 28. Convective Outlook Chart Convective Graphics
- 29. Conv. Outlook • Issued five times daily • Convective Activity • Hail • Tornadoes • Winds
- 30. Hail
- 31. Tornado
- 32. Winds
- 33. Forecast Winds & Temperatures Aloft Chart
- 34. FD • 12 hour forecasts valid at 0000Z & 1200Z daily • Read same as station model winds • 99 for calm winds with no arrow • Temps are shown in Celsius


