Well Plotter 3D - White Paper
- 1. Hydro Office Software for Water Sciences Well Plotter 1.0 White paper HydroOffice.org
- 2. White paper for Well Plotter software. ┬® Milo┼Ī Gregor, PhD. / milos.gregor@hydrooffice.org HydroOffice.org ŌĆō software for water science This file is published under Creative Common License
- 3. What is HydroOffice HydroOffice is a comprehensive software package designed for hydrology, hydrogeology, meteorology and environmental engineers. The HydroOffice package contains a number of separate installable tools which are distributed as freeware or are priced. Each tool is designed for a specific purpose, and these include; ŌĆó recession curve analysis of springs and rivers ŌĆó evaluation and analysis of extreme water conditions as in drought and flood ŌĆó production of flow duration curves ŌĆó calculation of minimum and maximum N-daily values ŌĆó baseflow separation ŌĆó separation of runoff components from recession curve analysis results ŌĆó calculation of long-term average groundwater runoff from basins ŌĆó time series analysis, editing, processing, visualization, evaluation and export ŌĆó geochemical visualizations ŌĆó 1D, 2D and 3D visualization of borehole and well data What Is Well Plotter Well Plotter is our latest tool in the HydroOffice software package. Its main function is visual analysis and interpretation of drilling data using 1D, 2D and 3D visualization. This program was developed for fast easy use of modern technology, and, 99% of our visualizations are created as hardware accelerated vector graphics. The Well Plotter is released in two editions. The first edition is a basic version which includes map visualization and data display in 1D Well Log. The second edition features 3D spatial imaging. It has greater complexity, giving you 2D geological profiles with 3D data display, and the added advantage of spatial data import from GIS files. Most importantly, you can install a Demo version, which includes the functionality of both editions. Therefore, you can try the program before you buy it. Well Plotter Input data import Save project file 1D Well log 2D geological section 3D fence diagram Visualization export Well Plotter 3D Demo version Yes Yes Yes No No Yes Yes Yes Yes Yes Yes Yes Yes No Yes Yes Yes No
- 4. Tool User Interface The programŌĆÖs user interface was designed for fast efficient work, and it is controlled by a ribbon toolbar and auxiliary panels. The ribbon toolbar is dynamic and always displays the features you are currently using. Individual application panels manage all data in your project. There are separate visualizations of 2D geological sections together with all data related to wells and boreholes. You can save your prepared project to file while you are working on it, and it is always available at later stages when you continue work or if you want to refer to it.
- 5. Data Types This program allows you to work with all variable data types. These include technical well diagrams, geological rock descriptions, numerical measurements, tectonic data, text descriptions, images and photos and point measurement time series at your predefined depths. Data preparation in this program is very simple. You can create input data directly using the built-in editors, by importing CSV files or directly from spreadsheets using ŌĆ£Copy-PasteŌĆØ; so that all these features greatly speed up your work. Creation of 2D geological sections is simple. You just need to use the built-in editor. For 3D visualization, you can directly import ESRI Shape Files with spatial data, together with Grids
- 7. 2D Cross Sections / Geological Schemes The 3D edition of this program also includes functions for displaying data in 2D space. This feature allows you to display combined 2D sections of two wells. In addition to all the geological schemes, the program also lets you create 2D heat-maps from imported numerical data. This can be combined with drilling data to create the 2D schemes from any number of wells and 2D sections in one single diagram.
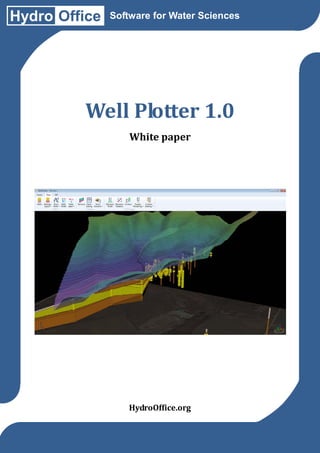
- 8. 3D View / 3D Fence diagrams The 3D Program Edition also gives you the ability to create dynamic 3D visualizations using combined data from boreholes and wells, and from 2D geological sections and GIS spatial data. All data can be arbitrarily combined and visually edited, so that each object in your rendered 3D scene is freely available.
- 10. Conclusion Our new Well Plotter and Well Plotter 3D programs allow you to display, analyze and process variable data from boreholes and wells. You can import as much data as you wish into the program and render it in impressive visualizations. The basic program edition lets you create 1D Well Logs, while the extended 3D Edition has data visualizations in 2D and 3D space. These programs are suitable for practical use in hydrogeology, engineering geology and geotechnics. The beauty of our offer is that you can test the Demo version, which contains all functionality before buying the program. In addition, everything you need to know to effortlessly work with the program is contained on our webpage at http://hydrooffice.org. Finally, the following pages demonstrate examples of the great results you obtain working with the Well Plotter software.


