What are product recommendations, and how do they work?
ŌĆó
3 likesŌĆó751 views

The content of this presentation is based on: Chapter 1, 2 and 4 of the following book: Owen, Anil, Dunning, Friedman. Mahout in Action. Shelter Island, NY: Manning Publications Co., 2012. Chapter ŌĆ£Discussion of Similarity MetricsŌĆØ of the following publication: Shanley Philip. Data Mining Portfolio.


![Septem
ber 1,
2012
The output could be: [item:104, value:4.257081]" 16
The recommender engine did so because it
estimated user 1ŌĆÖs preference for 104 to be
about 4.3, and that was the highest among all
the items eligible for recommendation.
Questions:
ŌĆóŌĆ» Is this the best recommendation for user 1?
ŌĆóŌĆ» What exactly is a good recommendation?
A Simple user-based Example
Analyzing the Output](https://image.slidesharecdn.com/nam-ecommerce-collaborativfiltering-120901065505-phpapp02/85/What-are-product-recommendations-and-how-do-they-work-16-320.jpg)


![Septem
ber 1,
2012
A Simple Recommender 22
class RecommenderExample {"
ŌĆ” main(String[] args) throws ŌĆ” {"
DataModel model = new FileDataModel(new File(ŌĆ£examle.csv")); "
UserSimilarity similarity = "
new PearsonCorrelationSimilarity(model);"
UserNeighborhood neighborhood = "
new NearestNUserNeighborhood(2, similarity, model);"
Recommender recommender = "
new GenericUserBasedRecommender(model, neighborhood, similarity);"
List<RecommendedItem> recommendations = recommender.recommend(1, 1);"
" for (RecommendedItem recommendation : recommendations) {"
System.out.println(recommendation);"
}"
}}"
┬Ā
A Simple user-based Example
Create a Recommender](https://image.slidesharecdn.com/nam-ecommerce-collaborativfiltering-120901065505-phpapp02/85/What-are-product-recommendations-and-how-do-they-work-22-320.jpg)


What are product recommendations, and how do they work?
- 1. CC 2.0 by Horia Varlan | http://’¼éic.kr/p/7vjmof
- 2. Septem ber 1, 2012 ŌĆóŌĆ» What are Product Recommenders 2 ŌĆóŌĆ» Introducing Recommenders ŌĆóŌĆ» A Simple Example ŌĆóŌĆ» Recommender Evaluation ŌĆóŌĆ» How do they work? ŌĆóŌĆ» Machine learning tool ŌĆō Apache Mahout Namics Conference 2012 Agenda
- 3. Septem ber 1, 2012 ŌĆóŌĆ» Spin-o’¼Ć of MeMo News AG, the 3 leading provider for Social Media Monitoring & Analytics in Switzerland ŌĆóŌĆ» Big Data expert, focused on Hadoop, HBase and Solr ŌĆóŌĆ» Objective: Transforming data into insights Intro About Sentric
- 4. CC 2.0 by Dennis Wong | http://’¼éic.kr/p/6C3RuV ┬Ā
- 5. Septem ber 1, 2012 ŌĆóŌĆ» Each day we form opinions about 5 things we like, donŌĆÖt like, and donŌĆÖt even care about. ŌĆóŌĆ» People tend to like things ŌĆ” ŌĆóŌĆ» that similar people like ŌĆóŌĆ» that are similar to other things they like ŌĆóŌĆ» These patterns can be used to predict such likes and dislikes. Introducing Recommenders The Patterns
- 6. Septem ber 1, 2012 user-based ŌĆō Look to what people with 6 similar tastes seem to like Example: Introducing Recommenders Strategies for Discovering New Things
- 7. Septem ber 1, 2012 item-based ŌĆō Figure out what items are 7 like the ones you already like (again by looking to othersŌĆÖ apparent preferences) Example: Introducing Recommenders Strategies for Discovering New Things
- 8. Septem ber 1, 2012 content-based ŌĆō Suggest items based on 8 Septem particular attribute (again by looking to othersŌĆÖ apparent ber 1, 2012 preferences) Example: Introducing Recommenders Strategies for Discovering New Things
- 9. Septem ber 1, 2012 9 Collaborative Filtering ŌĆō Item-based Producing recommendations based on, and only based on, knowledge of usersŌĆÖ User-based Content-based relationships to items. Recommenders Recommendation is all about predicting patterns of taste, and using them to discover new and desirable things you didnŌĆÖt already know about. Introducing Recommenders The De’¼ünition of Recommendation
- 10. CC 2.0 by Will Scullin | http://’¼éic.kr/p/6K9jb8 ┬Ā
- 11. Septem ber 1, 2012 ŌĆóŌĆ» LetŌĆÖs start with a simple example 11 Create ┬ĀInput ┬Ā Create ┬Āa ┬Ā Analyse ┬Āthe ┬Ā Data ┬Ā Recommender ┬Ā Output ┬Ā A Simple user-based Example The Work’¼éow
- 12. Septem ber 1, 2012 ŌĆóŌĆ» Recommendations will 1,101,5.0 ŌĆ© 12 1,102,3.0 ŌĆ© base on input-data User 1 has a preference 3.0 1,103,2.5 ŌĆ© for item 102 2,101,2.0 ŌĆ© ŌĆóŌĆ» Data takes the form of 2,102,2.5 ŌĆ© preferences ŌĆōassociations 2,103,5.0 ŌĆ© 2,104,2.0 ŌĆ© from users to items 3,101,2.5 ŌĆ© 3,104,4.0 ŌĆ© 3,105,4.5 ŌĆ© 3,107,5.0 ŌĆ© Example: 4,101,5.0 ŌĆ© 4,103,3.0" 4,104,4.5" These values might be ratings 4,106,4.0" on a scale of 1 to 5, where 1 5,101,4.0" 5,102,3.0" indicates items the user canŌĆÖt 5,103,2.0" 5,104,4.0" stand, and 5 indicates 5,105,3.5" favorites. 5,106,4.0 " ┬Ā ┬Ā A Simple user-based Example Input Data
- 13. Septem ber 1, 2012 ŌĆóŌĆ» Trend visualization for positive users 1,101,5.0 ŌĆ© 13 1,102,3.0 ŌĆ© preferences (in petrol) 1,103,2.5 ŌĆ© 2,101,2.0 ŌĆ© 2,102,2.5 ŌĆ© 1 5 3 2,103,5.0 ŌĆ© 2,104,2.0 ŌĆ© 3,101,2.5 ŌĆ© 3,104,4.0 ŌĆ© 3,105,4.5 ŌĆ© 101 102 103 104 105 106 107 3,107,5.0 ŌĆ© 4,101,5.0 ŌĆ© 4,103,3.0" 4,104,4.5" 4,106,4.0" 5,101,4.0" 2 4 5,102,3.0" 5,103,2.0" 5,104,4.0" ŌĆóŌĆ» All other preferences are recognized as 5,105,3.5" negative ŌĆō the user doesnŌĆÖt seem to like the 5,106,4.0 " item that much (red, dotted) ┬Ā ┬Ā A Simple user-based Example Trend Visualization
- 14. Septem ber 1, 2012 Users 1 and 5 seem to have similar tastes. 14 Both like 101, like 102 a little less, and like 103 less still 1 5 101 102 103 104 105 106 107 Users 1 and 4 seem to have similar tastes. Both 2 4 seem to like 101 and 103 identically Users 1 and 2 have tastes that seem to run counter to each other A Simple user-based Example Trend Visualization
- 15. Septem ber 1, 2012 So what product might be recommended to 15 user 1? 1 5 3 101 102 103 104 105 106 107 2 4 Obviously not 101, 102 or 103. User 1 already knows about these. A Simple user-based Example Analyzing the Output
- 16. Septem ber 1, 2012 The output could be: [item:104, value:4.257081]" 16 The recommender engine did so because it estimated user 1ŌĆÖs preference for 104 to be about 4.3, and that was the highest among all the items eligible for recommendation. Questions: ŌĆóŌĆ» Is this the best recommendation for user 1? ŌĆóŌĆ» What exactly is a good recommendation? A Simple user-based Example Analyzing the Output
- 17. CC 2.0 by larsaaboe | http://’¼éic.kr/p/7nJpV8 ┬Ā
- 18. Septem ber 1, 2012 Goal: 18 Evaluate how closely the estimated preferences match the actual preferences. How? Produce Compare estimate estimates with Reasonable 30% for test Prepare Split Run preferences Analyse test data ├Ā’āĀ data set ┬Ā 70 % for training with training Calculate a data score Experiment with other recommenders A Simple user-based Example Evaluating a Recommender
- 19. Septem ber 1, 2012 Example evaluation output for a 19 particular recommender engine Item 1 Item 2 Item 3 Actual 3.0 5.0 4.0 Estimate 3.5 2.0 5.0 Di’¼Ćerence 0.5 3.0 1.0 Average distance = (0.5+3.0+1.0)/3=1.5 Root-mean-square =ŌłÜ((0.52+3.02+1.02)/3)=1.8484 Note: A score of 0.0 would mean perfect estimation A Simple user-based Example Evaluating a Recommender
- 20. CC 2.0 by amtrak_russ | http://’¼éic.kr/p/6fAPej ┬Ā
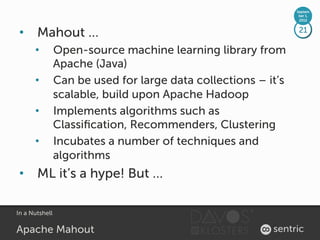
- 21. Septem ber 1, 2012 ŌĆóŌĆ» Mahout ŌĆ” 21 ŌĆóŌĆ» Open-source machine learning library from Apache (Java) ŌĆóŌĆ» Can be used for large data collections ŌĆō itŌĆÖs scalable, build upon Apache Hadoop ŌĆóŌĆ» Implements algorithms such as Classi’¼ücation, Recommenders, Clustering ŌĆóŌĆ» Incubates a number of techniques and algorithms ŌĆóŌĆ» ML itŌĆÖs a hype! But ŌĆ” In a Nutshell Apache Mahout
- 22. Septem ber 1, 2012 A Simple Recommender 22 class RecommenderExample {" ŌĆ” main(String[] args) throws ŌĆ” {" DataModel model = new FileDataModel(new File(ŌĆ£examle.csv")); " UserSimilarity similarity = " new PearsonCorrelationSimilarity(model);" UserNeighborhood neighborhood = " new NearestNUserNeighborhood(2, similarity, model);" Recommender recommender = " new GenericUserBasedRecommender(model, neighborhood, similarity);" List<RecommendedItem> recommendations = recommender.recommend(1, 1);" " for (RecommendedItem recommendation : recommendations) {" System.out.println(recommendation);" }" }}" ┬Ā A Simple user-based Example Create a Recommender
- 23. Septem ber 1, 2012 23 <<interface>> ┬Ā UserSimilarity ┬Ā <<interface>> ┬Ā <<interface>> ┬Ā ApplicaAon ┬Ā Recommender ┬Ā DataModel ┬Ā <<interface>> ┬Ā UserNeighborhood ┬Ā A user-based Recommender Component Interaction
- 24. Septem ber 1, 2012 NearestNUserNeighborhood ThresholdUserNeighborhood 24 2 ┬Ā 2 ┬Ā 1 ┬Ā 1 ┬Ā 5 ┬Ā 5 ┬Ā 3 ┬Ā 3 ┬Ā 4 ┬Ā 4 ┬Ā A neighborhood around user 1 is chosen to consist of the De’¼üning a neighborhood of three most similar users: 5, 4, most-similar users with a and 2 similarity threshold Algorithms UserNeighborhood
- 25. Septem ber 1, 2012 Implementations of this interface de’¼üne a 25 notion of similarity between two users. Implementations should return values in the range -1.0 to 1.0, with 1.0 representing perfect similarity. <<interface>>ŌĆ© UserSimilarity" EuclideanDistance PearsonCorrelation UncenteredCosine Similarity" Similarity" Similarity" LogLikelihood TanimotoCoefficient ..." Similarity" Similarity" Algorithms User Similarity
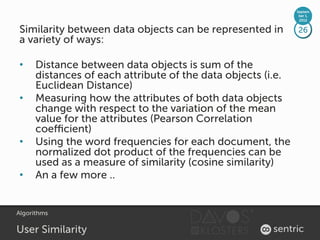
- 26. Septem ber 1, 2012 Similarity between data objects can be represented in 26 a variety of ways: ŌĆóŌĆ» Distance between data objects is sum of the distances of each attribute of the data objects (i.e. Euclidean Distance) ŌĆóŌĆ» Measuring how the attributes of both data objects change with respect to the variation of the mean value for the attributes (Pearson Correlation coe’¼ācient) ŌĆóŌĆ» Using the word frequencies for each document, the normalized dot product of the frequencies can be used as a measure of similarity (cosine similarity) ŌĆóŌĆ» An a few more .. Algorithms User Similarity
- 27. Septem ber 1, 2012 Similarity between 27 two data objects: 5 4 User 5 User 1 3 102 User 2 2 1 User 3 User 4 0 0 1 2 3 4 5 101 Mathematically & Plot Euclidean Distance
- 28. Septem ber 1, 2012 Similarity between 28 two data objects: 5 4.5 4 104 101 3.5 3 102 User 5 2.5 2 103 1.5 1 0.5 0 0 1 2 3 4 5 User 1 Mathematically & Plot Pearson Correlation
- 29. Septem ber 1, 2012 29 Questions? Jean-Pierre K├Čnig, jean-pierre.koenig@sentric.ch Namics Conference 2012 Thank you!
- 30. Septem ber 1, 2012 ŌĆóŌĆ» References 30 The content of this presentation is based on: ŌĆóŌĆ» Chapter 1, 2 and 4 of the following book: Owen, Anil, Dunning, Friedman. Mahout in Action. Shelter Island, NY: Manning Publications Co., 2012. ŌĆóŌĆ» Chapter ŌĆ£Discussion of Similarity MetricsŌĆØ of the following publication: Shanley Philip. Data Mining Portfolio. ŌĆóŌĆ» Links http://bitly.com/bundles/jpkoenig/1 A Simple user-based Example Literatur & Links