Why project data matters - a visual dot-to-dot analogy
- 1. DOT TO DOT ANALOGY Image source BD Online ┬® Charlie Woodley, Hill International (UK) Ltd
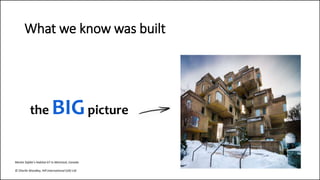
- 2. the BIGpicture What we know was built Moshe SafdieŌĆÖs Habitat 67 in Montreal, Canada ┬® Charlie Woodley, Hill International (UK) Ltd
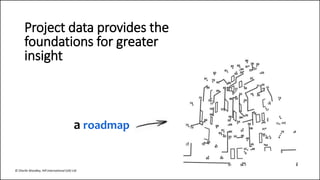
- 3. Project data provides the foundations for greater insight a roadmap ┬® Charlie Woodley, Hill International (UK) Ltd
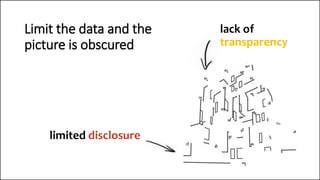
- 4. limited disclosure lack of transparency Limit the data and the picture is obscured
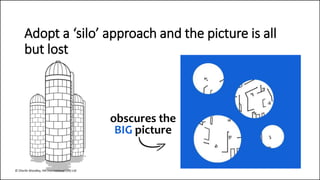
- 5. Adopt a ŌĆśsiloŌĆÖ approach and the picture is all but lost obscures the BIG picture ┬® Charlie Woodley, Hill International (UK) Ltd
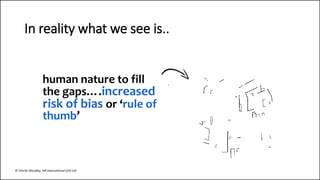
- 6. In reality what we see is.. human nature to fill the gapsŌĆ”.increased risk of bias or ŌĆśrule of thumbŌĆÖ ┬® Charlie Woodley, Hill International (UK) Ltd
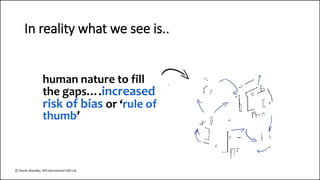
- 7. In reality what we see is.. human nature to fill the gapsŌĆ”.increased risk of bias or ŌĆśrule of thumbŌĆÖ ┬® Charlie Woodley, Hill International (UK) Ltd
- 8. ? ?? ? UncertaintyŌĆ”. ┬® Charlie Woodley, Hill International (UK) Ltd
- 9. Avoidable costŌĆ”. ┬® Charlie Woodley, Hill International (UK) Ltd
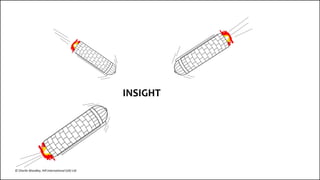
- 10. INSIGHT ┬® Charlie Woodley, Hill International (UK) Ltd
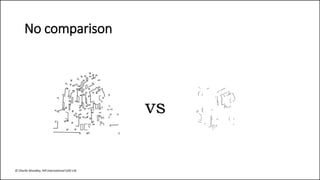
- 11. No comparison vs ┬® Charlie Woodley, Hill International (UK) Ltd
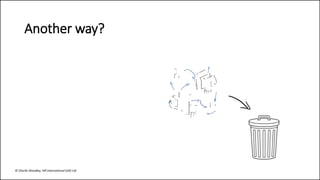
- 12. Another way? ┬® Charlie Woodley, Hill International (UK) Ltd
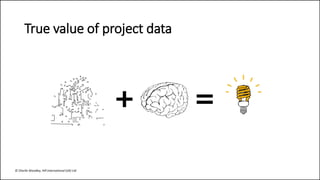
- 13. True value of project data + = ┬® Charlie Woodley, Hill International (UK) Ltd
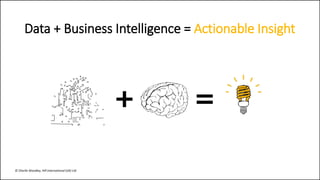
- 14. Data + Business Intelligence = Actionable Insight + = ┬® Charlie Woodley, Hill International (UK) Ltd
- 15. Charlie Woodley Director Hill International (UK) Ltd 11 Pilgrim Street, London EC4V 6RN Mobile: +44 (0)7990 587 322 charliewoodley@hillintl.com Insight + Value in project data Business Intelligence
Editor's Notes
- #2: Settled on dot to dot analogy as it best illustrates the importance of data to understanding the big picture
- #3: Moshe SafdieŌĆÖs Habitat 67 in Montreal, Canada but could as easily be a FPSO or hydroelectric plant
- #4: Data provides not just the each dot but the sequence With all the data it is a relatively straightforward exercise to understand what you are looking at But what happens when a stakeholder withholds information, intentionally or otherwise?
- #5: All of a sudden it is far more difficult to interpret the what you are looking atŌĆ”.something that would be significantly more difficult if you had not been imprinted by the images on the preceding two slide The link between lack of information and cost is often missed by those responsible for withholding information and a key challenge is to communicate this
- #6: A professional, looking to add value compound the issue by using a siloŌĆÖd approach to analysing the data
- #7: Without the benefit of the blue mask on the preceding slide a siloŌĆÖd approach would appear as follows This is where our predictable irrationality is the greatest riskŌĆ”.the temptation to fill gaps, to grasp for answers
- #8: The result
- #11: In short silos severely impact on individual or team ability to see the big picture
- #14: The challenge is how to take ŌĆśbig dataŌĆÖ and combine with our expertise and experience to produce genuine insight for clients
- #15: The challenge is how to take ŌĆśbig dataŌĆÖ and combine with our expertise and experience to produce genuine insight for clients

