ºÝºÝߣ

ºÝºÝߣShare a Scribd company logo
Week Commencing 17th October 2005                                               Semester 1: Week 4


31 101 ECONOMICS I
Tutorial Worksheet No.2
Topic: Supply & Demand
 Name:                                               Registration No:

 Tutor:                                              Tutorial Group:

Homework

Charlie and Sharleen have a new flatmate called Craig.                  Craig and Charlie are
friends who like to drink lager together.

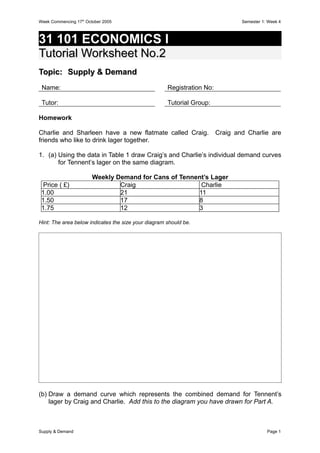
1. (a) Using the data in Table 1 draw Craig’s and Charlie’s individual demand curves
       for Tennent’s lager on the same diagram.

                        Weekly Demand for Cans of Tennent’s Lager
  Price ( £)                    Craig                   Charlie
 1.00                           21                     11
 1.50                           17                     8
 1.75                           12                     3

Hint: The area below indicates the size your diagram should be.


(b) Draw a demand curve which represents the combined demand for Tennent’s
    lager by Craig and Charlie. Add this to the diagram you have drawn for Part A.


Supply & Demand                                                                            Page 1
Week Commencing 17th October 2005                                       Semester 1: Week 4


2. (a) List three factors (apart from price) which are likely to affect Craig's demand
       for Tennent’s lager.

 1.


 2.


 3.


(b) Using new diagrams (one for each factor listed in response to Part A) show the
    effect upon the likely position of Craig's demand curve of a change in each of
    these three factors.

Diagram 1:


Supply & Demand                                                                    Page 2
Week Commencing 17th October 2005   Semester 1: Week 4


Diagram 2:


Diagram 3:


Supply & Demand                                Page 3
Week Commencing 17th October 2005                                                                     Semester 1: Week 4


Class Problem:

Discuss the effects of:
(a) an increase in the cost of hops upon the market for Tennent’s lager;
(b) a fall in the price of satellite dishes upon the market for cable TV.
Hint: Your answers should make use of appropriate market supply and demand diagrams and you should follow through each
      step in the argument. For example, how will an increase in the cost of hops (an input to lager production) alter the
      position of the demand and/or supply curves for lager Is there an excess demand or supply for lager at the original
      market price? How does the market price for beer respond? How does this eliminate any excess supply or demand?
      How do the new equilibrium market price and quantity traded compare with the original equilibrium values?


Diagram and discussion in response to Part (a):


Diagram and discussion in response to Part (b):


Supply & Demand                                                                                                    Page 4
More Related Content

Worksheet 3 4

  • 1. Week Commencing 17th October 2005 Semester 1: Week 4 31 101 ECONOMICS I Tutorial Worksheet No.2 Topic: Supply & Demand Name: Registration No: Tutor: Tutorial Group: Homework Charlie and Sharleen have a new flatmate called Craig. Craig and Charlie are friends who like to drink lager together. 1. (a) Using the data in Table 1 draw Craig’s and Charlie’s individual demand curves for Tennent’s lager on the same diagram. Weekly Demand for Cans of Tennent’s Lager Price ( £) Craig Charlie 1.00 21 11 1.50 17 8 1.75 12 3 Hint: The area below indicates the size your diagram should be. (b) Draw a demand curve which represents the combined demand for Tennent’s lager by Craig and Charlie. Add this to the diagram you have drawn for Part A. Supply & Demand Page 1
  • 2. Week Commencing 17th October 2005 Semester 1: Week 4 2. (a) List three factors (apart from price) which are likely to affect Craig's demand for Tennent’s lager. 1. 2. 3. (b) Using new diagrams (one for each factor listed in response to Part A) show the effect upon the likely position of Craig's demand curve of a change in each of these three factors. Diagram 1: Supply & Demand Page 2
  • 3. Week Commencing 17th October 2005 Semester 1: Week 4 Diagram 2: Diagram 3: Supply & Demand Page 3
  • 4. Week Commencing 17th October 2005 Semester 1: Week 4 Class Problem: Discuss the effects of: (a) an increase in the cost of hops upon the market for Tennent’s lager; (b) a fall in the price of satellite dishes upon the market for cable TV. Hint: Your answers should make use of appropriate market supply and demand diagrams and you should follow through each step in the argument. For example, how will an increase in the cost of hops (an input to lager production) alter the position of the demand and/or supply curves for lager Is there an excess demand or supply for lager at the original market price? How does the market price for beer respond? How does this eliminate any excess supply or demand? How do the new equilibrium market price and quantity traded compare with the original equilibrium values? Diagram and discussion in response to Part (a): Diagram and discussion in response to Part (b): Supply & Demand Page 4