Wrangling OWASP Top10 data at BSides Pittsburgh PGH
- 1. z DATA WRANGLING LESSONS FROM THE OWASP TOP 10 BSIDES PITTSBURGH JUNE 21, 2018 BRIAN GLAS @infosecdad
- 2. z OWASP TOP 10 OVERVIEW ┬¦ First version was released in 2003 ┬¦ Updated in 2004, 2007, 2010, 2013, 2017 ┬¦ Started as an awareness document ┬¦ Now widely considered the global baseline ┬¦ Is a standard for vendors to measure against
- 3. z OWASP TOP 10-2017 RC1 ┬¦ April 2017 ┬¦ Controversy over first release candidate ┬¦ Two new categories in RC1 ┬¦ A7 ŌĆō Insufficient Attack Protection ┬¦ A10 ŌĆō Underprotected APIs ┬¦ Social Media got ugly
- 4. z BLOG POSTS ┬¦ Decided to do a little research and analysis ┬¦ Reviewed the history of Top 10 development ┬¦ Analyzed the public data ┬¦ Wrote two blog postsŌĆ”
- 5. z DATA COLLECTION ┬¦ Original desire for full public attribution ┬¦ This meant many contributors, didnŌĆÖtŌĆ” ┬¦ End up mostly being consultants and vendors ┬¦ Hope to figure out a better way for 2020
- 6. z HUMAN-AUGMENTED TOOLS (HAT) VS. TOOL-AUGMENTED HUMANS (TAH) ┬¦ Frequency of findings ┬¦ Context (or lack thereof) ┬¦ Natural Curiosity ┬¦ Scalability ┬¦ Consistency
- 7. z HAT VS TAH
- 8. z HAT VS TAH
- 9. z HAT VS TAH
- 10. z TOOLING TOP 10
- 11. z HUMAN TOP 10
- 12. z
- 13. z OWASP SUMMIT JUNE 2017 ┬¦ Original leadership resigns right before ┬¦ I was there for SAMM working sessions ┬¦ Top 10 had working sessions as well ┬¦ Asked to help with data analysis for Top 10
- 14. z OWASP TOP 10-2017 ┬¦ New Plan ┬¦ Expanded data call, one of largest ever @ 114k ┬¦ Industry Survey to select 2 of 10 categories ┬¦ Fully open process in GitHub ┬¦ Actively translate into multiple languages ┬¦ en, es, fr, he, id, ja, koŌĆ”
- 15. z INDUSTRY SURVEY ┬¦ Looking for two forward looking categories ┬¦ 550 responses
- 16. z INDUSTRY SURVEY RESULTS ┬¦ 550 responses ┬¦ Thank you!
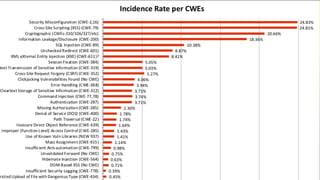
- 18. z DATA CALL RESULTS ┬¦ A change from frequency to incident rate ┬¦ Extended Data Call added: More Veracode, Checkmarx, Security Focus (Fortify), Synopsys, Bug Crowd ┬¦ Data for over 114,000 applications
- 21. z DATA CALL RESULTS
- 22. z DATA CALL RESULTS ┬¦ Percentage of submitting organizations that found at least one instance in that vulnerability category
- 23. z WHAT CAN THE DATA TELL US ┬¦ Humans still find more diverse vulnerabilities ┬¦ Tools only look for what they know about ┬¦ Tools can scale on a subset of tests ┬¦ You need both ┬¦ We arenŌĆÖt looking for everythingŌĆ”
- 24. z WHAT CAN THE DATA NOT TELL US ┬¦ Is a language or framework more susceptible ┬¦ Are the problems systemic or one-off ┬¦ Is developer training effective ┬¦ Are IDE plug-ins effective ┬¦ How unique are the findings? ┬¦ Consistent mapping? ┬¦ Still only seeing part of the picture
- 25. z VULN DATA IN PROD VS TESTING 0 0.5 1 1.5 2 2.5 3 0 0.5 1 1.5 2 2.5 3 3.5 Number of Vulnerabilities in Production
- 26. z VULN DATA IN PROD VS TESTING 0 0.5 1 1.5 2 2.5 3 0 0.5 1 1.5 2 2.5 3 3.5 Security Defects in Testing
- 27. z VULN DATA STRUCTURES ┬¦ CWE Reference ┬¦ Related App ┬¦ Date ┬¦ Language/Framework ┬¦ Point in the process found ┬¦ Severity (CVSS/CWSS/Something) ┬¦ Verified
- 28. z VULN DATA IN SECURITY STORIES
- 29. z WHAT ABOUT TRAINING DATA? ┬¦ How are you measuring training? ┬¦ Are you correlating data from training to testing automation? ┬¦ Can you track down to the dev? ┬¦ Do you know your Top 10?
- 30. z WHAT CAN YOU DO? ┬¦ Think about what story to tell, then figure what data is needed to tell that story ┬¦ Structure your data collection ┬¦ Keep your data as clean and accurate as possible ┬¦ Write stories ┬¦ Consider contributing to Top 10 2020
- 31. z THATŌĆÖS ALL FOLKS THANK YOU! ┬¦ Brian Glas ┬¦ @infosecdad ┬¦ brian.glas@gmail.com


