XXXXXXX
Download as pptx, pdf0 likes2,779 views

This document contains a summary of a computer studies class on data representation and analysis. It includes a table with the number of audiences for 5 movies in 2012. A bar chart is presented showing the number of students' favorite movie genres, with romance, action, animation, sci-fi, historical, drama, and comedy on the horizontal axis and number of students on the vertical axis. The conclusion discusses how bar charts make comparisons and trends in data easy to see and determine the value of one variable given the other.
1 of 9
Download to read offline
Ad
Recommended
Bill Clinton Simulator
Bill Clinton SimulatorAshley Jose
?
Bill Clinton Simulator 2015 is a first-person decision-based simulation game where the player takes on the role of Bill Clinton and must avoid impeachment during the Monica Lewinsky scandal. The game includes scenes such as an introduction in the Oval Office, transitioning to the Congress building, questioning in the Senate where the player must answer questions to avoid impeachment, and one of two possible outcomes depending on the player's choices.Graphical presentation of frequency distribution of statistical data.pptx
Graphical presentation of frequency distribution of statistical data.pptxraven001905
?
The document provides an overview of various graphical presentations of frequency distribution, including histograms, bar charts, pie charts, frequency polygons, and line graphs. Each type is explained with examples and visual representations to illustrate data such as test scores and favorite fruits. It aims to enhance understanding of how to effectively visualize and analyze statistical data.Statistics and probability
Statistics and probabilityDilip Kumar Tiwari
?
Data is a collection of facts that can be qualitative (descriptive) or quantitative (numerical). Quantitative data can be discrete (counting whole numbers) or continuous (measuring any value within a range). Data can be collected through direct observation or surveys, with a census collecting all data and a sample collecting some data. Data is represented graphically through charts, graphs, and plots to show relationships and trends.RESEARCH MRTHODOLOGY
RESEARCH MRTHODOLOGYLohasri
?
This document discusses graphical representation of data through various charts and diagrams. It introduces common types of graphs like line diagrams, bar diagrams, pie charts and histograms. Bar diagrams are used to compare data between groups, pie charts show proportions, and histograms display frequency distributions. Graphical representation makes data easier to visualize, compare, understand and analyze compared to raw numbers. Examples of each type of graph are provided to illustrate how data can be visually depicted.Statistics
Statisticsdiereck
?
This document discusses different types of graphs used to present statistical data. It provides examples and guidelines for bar graphs, pie charts, histograms, line graphs, and pictographs. Bar graphs can show categorical data and frequencies. Pie charts represent qualitative data through wedge-shaped slices. Histograms use bars to depict continuous data grouped into ranges or classes. Line graphs illustrate relationships that change over time. Pictographs use images to demonstrate quantities. Being able to interpret and construct these various graphs is important for analyzing real-world data.Chapter Two (PART ONE).pptx
Chapter Two (PART ONE).pptxMohammedYonis2
?
The document describes descriptive statistics and methods for presenting qualitative and quantitative data. It discusses frequency distributions, relative frequencies, percentages and graphs including bar charts, pie charts, and line graphs. Examples show how to construct these graphs and calculate values for datasets. Exercises provide practice creating frequency tables, determining relative frequencies and percentages, and representing data using pie charts.introduction to statistics
introduction to statisticsBasit00786
?
This document provides a summary of different types of graphical representations of data. It begins with an introduction to graphical representation, explaining that graphs make data easier to understand versus words alone. Then, it discusses several specific types of graphs:
- Bar graphs and histograms to represent grouped or ungrouped data
- Line graphs to show changes over time
- Pie charts to compare parts of a whole
It also provides examples of each type of graph and discusses their importance and applications. The document aims to explain the basic principles of graphical representation and how different graph types can be used to visualize various types of statistical data.Graphical representation of Data in Research.pdf
Graphical representation of Data in Research.pdfsoniasehrawat5
?
This document provides an overview and examples of different types of graphical data presentations including bar graphs, pie charts, line graphs, and histograms. Bar graphs use rectangular bars to compare discrete data across categories. Pie charts represent data as fractional parts of a whole in a circular graph. Line graphs show changes over continuous time. Histograms use rectangles to display the distribution of continuous data grouped into bins. Each type of graph has advantages for visualizing certain types of data relationships.Chapter 5 sections 5 c and 5d
Chapter 5 sections 5 c and 5dmichaelsisk
?
This document provides information on different types of charts and graphs that can be used to display statistical data in the media. It discusses frequency tables, bar charts, pie charts, histograms, line charts, and other types of graphs such as multiple bar graphs, stack plots, geographic data displays, 3D graphs, and pictographs. The document emphasizes that all graphs should include a clear title, scaled axes, and legend; and it provides examples of qualitative and quantitative data that could be represented in different graph formats.Data handling -
Data handling -Manpreet Singh
?
This document discusses different methods of graphically representing data, including bar graphs, double bar graphs, histograms, and pie charts. It provides examples and definitions of each type of graph. Frequency distribution and how it arranges values from a sample into groups or intervals is also covered. Examples are given showing classifications of data values and their frequencies.Lecture 7 creating_charts1
Lecture 7 creating_charts1BBAMUMU2014
?
This document provides an overview of different types of charts used to represent data visually, including line graphs, pie charts, and bar graphs. It explains that charts allow large amounts of numeric data to be interpreted easily and concisely by representing the information graphically. The document describes the basic components and purposes of line graphs for showing trends over time, pie charts for displaying percentages of parts that make up a whole, and bar graphs for comparing quantities across different categories. Examples are given for each type of chart. Readers are encouraged to practice creating charts from their own data sets.Data handling
Data handlingyashwant kondeti
?
This document discusses different methods of graphically representing data, including bar graphs, double bar graphs, histograms, and pie charts. It provides examples and descriptions of each type of graph. Bar graphs are used to plot discrete data and can be vertical or horizontal. Double bar graphs compare two sets of data with two bars. Histograms show data points within ranges. Pie charts illustrate proportions, with the arc length of each sector proportional to the quantity it represents.Different Types of Graphs.ppt
Different Types of Graphs.pptShivamKushwaha78
?
This document discusses different types of graphs used to display data:
- Circle graphs (pie charts) show portions of a whole or group using a circle divided into sectors
- Bar graphs display data using bars of equal width on a grid for comparisons
- Pictographs use pictures/symbols to represent data, with a key explaining each symbol
- Broken line graphs join data points with line segments to show trends over time
- Continuous line graphs have meaning for points on the line between plotted points
- Scatter plots graph sets of points with no implied connections between themUnderstanding Excel Charts
Understanding Excel ChartsPaul Barnabas
?
This document provides an overview of understanding Excel charts. It defines common chart types like column, bar, pie, line, and scatter charts. It explains how to create basic charts in Excel and customize them by applying formats, templates, themes, and filters. Pivot tables and charts are also introduced as a way to analyze and visualize summarized data. The document aims to teach readers charting terminology and how to select the appropriate chart for their specific data set.Meeting 7 Different Types of Graphs (Materi Pendukung Part C).ppt
Meeting 7 Different Types of Graphs (Materi Pendukung Part C).pptaldorm0805
?
The document outlines data management learning goals, focusing on various types of graphs including circle graphs, bar graphs, pictographs, and line graphs for visual data representation. It provides examples of how to group data and pose questions related to graphical interpretation. Additionally, it discusses comparing average monthly temperatures between two towns using graphical analysis.Graphical representation of data mohit verma
Graphical representation of data mohit verma MOHIT KUMAR VERMA
?
This document discusses various methods of graphically representing data, including bar diagrams, pie charts, histograms, and line graphs. It describes the construction and purposes of simple bar diagrams, multiple bar diagrams, compound bar diagrams, pie charts, and histograms. The document emphasizes that graphical representations are important for conveying insights from data more effectively than tables alone and for understanding patterns.The Use of Data and Datasets in Data Science
The Use of Data and Datasets in Data ScienceDamian T. Gordon
?
The Use of Data and Datasets in Data ScienceOrganizational Data Analysis by Mr Mumba.pptx
Organizational Data Analysis by Mr Mumba.pptxbentrym2
?
The document discusses data analysis and describes a data analyst's responsibilities as summarizing, analyzing, and presenting data to stakeholders in a meaningful way. It explains that descriptive statistics are used to describe data through graphs, tables, and summary measures, while inferential statistics make predictions and inferences about populations based on sample data using estimation and hypothesis testing. Finally, it covers quantitative and qualitative variables, different measurement scales, and visual representations of data through tables, charts, and graphs.Different Types of Graphs
Different Types of GraphsEverromeAsico2
?
This document provides information about different types of graphs used to display data: circle graphs (pie charts) show portions of a whole, bar graphs allow for comparisons using vertical or horizontal bars of equal width, pictographs use pictures/symbols to represent data with a key, broken line graphs join data points with line segments to show trends over time, continuous line graphs have meaning for all points between plotted data points, and scatter plots graph sets of points without connection. Sample questions demonstrate using a bar graph to group student marks into intervals and creating a line graph to compare the average monthly temperatures of two towns over eight months.Different Types of Graphs.ppt
Different Types of Graphs.pptJessahMaeRPrincesa
?
This document provides information about different types of graphs used to display data: circle graphs (pie charts) show portions of a whole, bar graphs allow for comparisons using vertical or horizontal bars of equal width, pictographs use pictures/symbols to represent data with a key, broken line graphs join data points with line segments to show trends over time, continuous line graphs have meaning for all points between plotted data points, and scatter plots graph sets of points without connection. Sample questions demonstrate using a bar graph to group student marks into intervals and creating a line graph to compare the average monthly temperatures of two towns over eight months.kinds of graph for english 10 grammar ..
kinds of graph for english 10 grammar ..JessahMaeRPrincesa
?
This document discusses different types of graphs used to display data: circle graphs (pie charts) show portions of a whole, bar graphs allow for comparisons using vertical or horizontal bars of equal width, pictographs use pictures to represent data with a key, broken line graphs join data points to show trends over time, continuous line graphs have meaning between plotted points, and scatter plots display sets of paired data points. Sample questions demonstrate using a bar graph to group student marks into intervals and creating a line graph on the same grid to compare the average monthly temperatures of two towns over eight months.Different Types of Graphs Grade 10.ppt
Different Types of Graphs Grade 10.pptalonajane1
?
This document provides information about different types of graphs used to display data: circle graphs (pie charts) show portions of a whole, bar graphs allow for comparisons using vertical or horizontal bars of equal width, pictographs use pictures/symbols to represent data with a key, broken line graphs join data points over time, continuous line graphs have meaning between plotted points, and scatter plots show sets of plotted points. It includes sample questions about displaying student mark data in a bar graph and comparing average monthly temperatures in two towns using a line graph.Different Types of Graphs-1.pptDifferent Types of Graphs-1.ppt
Different Types of Graphs-1.pptDifferent Types of Graphs-1.pptGilbertGarcia40
?
This document provides information about different types of graphs used to display data: circle graphs (pie charts) show portions of a whole, bar graphs allow for comparisons using vertical or horizontal bars of equal width, pictographs use pictures/symbols to represent data with a key, broken line graphs join data points with line segments to show trends over time, continuous line graphs have meaning for all points between data points, and scatter plots display sets of paired data points. Sample questions demonstrate using a bar graph to group student marks into intervals and creating a line graph to compare the average monthly temperatures of two towns over eight months.Different Types of Graphs and their application
Different Types of Graphs and their applicationHodaFakour2
?
This document provides information about different types of graphs used to display data: circle graphs (pie charts) show portions of a whole, bar graphs allow for comparisons using vertical or horizontal bars of equal width, pictographs use pictures/symbols to represent data with a key, broken line graphs join data points with line segments to show trends over time, continuous line graphs have meaning for all points between plotted data points, and scatter plots graph sets of points without connection. Sample questions demonstrate using a bar graph to group student marks into intervals and creating a line graph to compare the average monthly temperatures of two towns over eight months.Different types of graphs
Different types of graphsReymarkDelaAustria
?
This document provides information about different types of graphs used to display data: circle graphs (pie charts) show portions of a whole, bar graphs allow for comparisons using vertical or horizontal bars of equal width, pictographs use pictures/symbols to represent data with a key, broken line graphs join data points with line segments to show trends over time, continuous line graphs have meaning for all points between data points, and scatter plots graph sets of points. Sample questions demonstrate using a bar graph to group student marks into intervals and creating a line graph to compare the average monthly temperatures of two towns over eight months.Different types of graphs
Different types of graphsOUR LADY OF ROSES MONTESORRI SCHOOL
?
This document provides information about different types of graphs used to display data: circle graphs (pie charts) show portions of a whole, bar graphs allow for comparisons using vertical or horizontal bars of equal width, pictographs use pictures/symbols to represent data with a key, broken line graphs join data points with line segments to show trends over time, continuous line graphs have meaning for all points between plotted data points, and scatter plots graph sets of points. Sample questions demonstrate using a bar graph to group student marks into intervals and creating a line graph to compare the average monthly temperatures of two towns over eight months.Yellow and Purple Doodle Startup Pitch Deck Presentation.pdf.pdf
Yellow and Purple Doodle Startup Pitch Deck Presentation.pdf.pdfkharadeshreya2210
?
Presentation on mark zuckerbergMore Related Content
Similar to XXXXXXX (20)
Graphical representation of Data in Research.pdf
Graphical representation of Data in Research.pdfsoniasehrawat5
?
This document provides an overview and examples of different types of graphical data presentations including bar graphs, pie charts, line graphs, and histograms. Bar graphs use rectangular bars to compare discrete data across categories. Pie charts represent data as fractional parts of a whole in a circular graph. Line graphs show changes over continuous time. Histograms use rectangles to display the distribution of continuous data grouped into bins. Each type of graph has advantages for visualizing certain types of data relationships.Chapter 5 sections 5 c and 5d
Chapter 5 sections 5 c and 5dmichaelsisk
?
This document provides information on different types of charts and graphs that can be used to display statistical data in the media. It discusses frequency tables, bar charts, pie charts, histograms, line charts, and other types of graphs such as multiple bar graphs, stack plots, geographic data displays, 3D graphs, and pictographs. The document emphasizes that all graphs should include a clear title, scaled axes, and legend; and it provides examples of qualitative and quantitative data that could be represented in different graph formats.Data handling -
Data handling -Manpreet Singh
?
This document discusses different methods of graphically representing data, including bar graphs, double bar graphs, histograms, and pie charts. It provides examples and definitions of each type of graph. Frequency distribution and how it arranges values from a sample into groups or intervals is also covered. Examples are given showing classifications of data values and their frequencies.Lecture 7 creating_charts1
Lecture 7 creating_charts1BBAMUMU2014
?
This document provides an overview of different types of charts used to represent data visually, including line graphs, pie charts, and bar graphs. It explains that charts allow large amounts of numeric data to be interpreted easily and concisely by representing the information graphically. The document describes the basic components and purposes of line graphs for showing trends over time, pie charts for displaying percentages of parts that make up a whole, and bar graphs for comparing quantities across different categories. Examples are given for each type of chart. Readers are encouraged to practice creating charts from their own data sets.Data handling
Data handlingyashwant kondeti
?
This document discusses different methods of graphically representing data, including bar graphs, double bar graphs, histograms, and pie charts. It provides examples and descriptions of each type of graph. Bar graphs are used to plot discrete data and can be vertical or horizontal. Double bar graphs compare two sets of data with two bars. Histograms show data points within ranges. Pie charts illustrate proportions, with the arc length of each sector proportional to the quantity it represents.Different Types of Graphs.ppt
Different Types of Graphs.pptShivamKushwaha78
?
This document discusses different types of graphs used to display data:
- Circle graphs (pie charts) show portions of a whole or group using a circle divided into sectors
- Bar graphs display data using bars of equal width on a grid for comparisons
- Pictographs use pictures/symbols to represent data, with a key explaining each symbol
- Broken line graphs join data points with line segments to show trends over time
- Continuous line graphs have meaning for points on the line between plotted points
- Scatter plots graph sets of points with no implied connections between themUnderstanding Excel Charts
Understanding Excel ChartsPaul Barnabas
?
This document provides an overview of understanding Excel charts. It defines common chart types like column, bar, pie, line, and scatter charts. It explains how to create basic charts in Excel and customize them by applying formats, templates, themes, and filters. Pivot tables and charts are also introduced as a way to analyze and visualize summarized data. The document aims to teach readers charting terminology and how to select the appropriate chart for their specific data set.Meeting 7 Different Types of Graphs (Materi Pendukung Part C).ppt
Meeting 7 Different Types of Graphs (Materi Pendukung Part C).pptaldorm0805
?
The document outlines data management learning goals, focusing on various types of graphs including circle graphs, bar graphs, pictographs, and line graphs for visual data representation. It provides examples of how to group data and pose questions related to graphical interpretation. Additionally, it discusses comparing average monthly temperatures between two towns using graphical analysis.Graphical representation of data mohit verma
Graphical representation of data mohit verma MOHIT KUMAR VERMA
?
This document discusses various methods of graphically representing data, including bar diagrams, pie charts, histograms, and line graphs. It describes the construction and purposes of simple bar diagrams, multiple bar diagrams, compound bar diagrams, pie charts, and histograms. The document emphasizes that graphical representations are important for conveying insights from data more effectively than tables alone and for understanding patterns.The Use of Data and Datasets in Data Science
The Use of Data and Datasets in Data ScienceDamian T. Gordon
?
The Use of Data and Datasets in Data ScienceOrganizational Data Analysis by Mr Mumba.pptx
Organizational Data Analysis by Mr Mumba.pptxbentrym2
?
The document discusses data analysis and describes a data analyst's responsibilities as summarizing, analyzing, and presenting data to stakeholders in a meaningful way. It explains that descriptive statistics are used to describe data through graphs, tables, and summary measures, while inferential statistics make predictions and inferences about populations based on sample data using estimation and hypothesis testing. Finally, it covers quantitative and qualitative variables, different measurement scales, and visual representations of data through tables, charts, and graphs.Different Types of Graphs
Different Types of GraphsEverromeAsico2
?
This document provides information about different types of graphs used to display data: circle graphs (pie charts) show portions of a whole, bar graphs allow for comparisons using vertical or horizontal bars of equal width, pictographs use pictures/symbols to represent data with a key, broken line graphs join data points with line segments to show trends over time, continuous line graphs have meaning for all points between plotted data points, and scatter plots graph sets of points without connection. Sample questions demonstrate using a bar graph to group student marks into intervals and creating a line graph to compare the average monthly temperatures of two towns over eight months.Different Types of Graphs.ppt
Different Types of Graphs.pptJessahMaeRPrincesa
?
This document provides information about different types of graphs used to display data: circle graphs (pie charts) show portions of a whole, bar graphs allow for comparisons using vertical or horizontal bars of equal width, pictographs use pictures/symbols to represent data with a key, broken line graphs join data points with line segments to show trends over time, continuous line graphs have meaning for all points between plotted data points, and scatter plots graph sets of points without connection. Sample questions demonstrate using a bar graph to group student marks into intervals and creating a line graph to compare the average monthly temperatures of two towns over eight months.kinds of graph for english 10 grammar ..
kinds of graph for english 10 grammar ..JessahMaeRPrincesa
?
This document discusses different types of graphs used to display data: circle graphs (pie charts) show portions of a whole, bar graphs allow for comparisons using vertical or horizontal bars of equal width, pictographs use pictures to represent data with a key, broken line graphs join data points to show trends over time, continuous line graphs have meaning between plotted points, and scatter plots display sets of paired data points. Sample questions demonstrate using a bar graph to group student marks into intervals and creating a line graph on the same grid to compare the average monthly temperatures of two towns over eight months.Different Types of Graphs Grade 10.ppt
Different Types of Graphs Grade 10.pptalonajane1
?
This document provides information about different types of graphs used to display data: circle graphs (pie charts) show portions of a whole, bar graphs allow for comparisons using vertical or horizontal bars of equal width, pictographs use pictures/symbols to represent data with a key, broken line graphs join data points over time, continuous line graphs have meaning between plotted points, and scatter plots show sets of plotted points. It includes sample questions about displaying student mark data in a bar graph and comparing average monthly temperatures in two towns using a line graph.Different Types of Graphs-1.pptDifferent Types of Graphs-1.ppt
Different Types of Graphs-1.pptDifferent Types of Graphs-1.pptGilbertGarcia40
?
This document provides information about different types of graphs used to display data: circle graphs (pie charts) show portions of a whole, bar graphs allow for comparisons using vertical or horizontal bars of equal width, pictographs use pictures/symbols to represent data with a key, broken line graphs join data points with line segments to show trends over time, continuous line graphs have meaning for all points between data points, and scatter plots display sets of paired data points. Sample questions demonstrate using a bar graph to group student marks into intervals and creating a line graph to compare the average monthly temperatures of two towns over eight months.Different Types of Graphs and their application
Different Types of Graphs and their applicationHodaFakour2
?
This document provides information about different types of graphs used to display data: circle graphs (pie charts) show portions of a whole, bar graphs allow for comparisons using vertical or horizontal bars of equal width, pictographs use pictures/symbols to represent data with a key, broken line graphs join data points with line segments to show trends over time, continuous line graphs have meaning for all points between plotted data points, and scatter plots graph sets of points without connection. Sample questions demonstrate using a bar graph to group student marks into intervals and creating a line graph to compare the average monthly temperatures of two towns over eight months.Different types of graphs
Different types of graphsReymarkDelaAustria
?
This document provides information about different types of graphs used to display data: circle graphs (pie charts) show portions of a whole, bar graphs allow for comparisons using vertical or horizontal bars of equal width, pictographs use pictures/symbols to represent data with a key, broken line graphs join data points with line segments to show trends over time, continuous line graphs have meaning for all points between data points, and scatter plots graph sets of points. Sample questions demonstrate using a bar graph to group student marks into intervals and creating a line graph to compare the average monthly temperatures of two towns over eight months.Different types of graphs
Different types of graphsOUR LADY OF ROSES MONTESORRI SCHOOL
?
This document provides information about different types of graphs used to display data: circle graphs (pie charts) show portions of a whole, bar graphs allow for comparisons using vertical or horizontal bars of equal width, pictographs use pictures/symbols to represent data with a key, broken line graphs join data points with line segments to show trends over time, continuous line graphs have meaning for all points between plotted data points, and scatter plots graph sets of points. Sample questions demonstrate using a bar graph to group student marks into intervals and creating a line graph to compare the average monthly temperatures of two towns over eight months.Recently uploaded (20)
Yellow and Purple Doodle Startup Pitch Deck Presentation.pdf.pdf
Yellow and Purple Doodle Startup Pitch Deck Presentation.pdf.pdfkharadeshreya2210
?
Presentation on mark zuckerbergLatest Avaya 71301T Exam Prep | Questions
Latest Avaya 71301T Exam Prep | Questionssabrina pinto
?
Start here---https://shorturl.at/k1wwp---Get complete detail on 71301T exam guide to crack Avaya Aura Communication Applications Technical Associate Implement (ASTA-7130). You can collect all information on 71301T tutorial, practice test, books, study material, exam questions, and syllabus. Firm your knowledge on Avaya Aura Communication Applications Technical Associate Implement (ASTA-7130) and get ready to crack 71301T certification. Explore all information on 71301T exam with number of questions, passing percentage and time duration to complete test.
Plant Evaluation and Historical Developments,PPT.pptx
Plant Evaluation and Historical Developments,PPT.pptx7300511143
?
Plant Evaluation and Historical Developments for PG Students, Fruit BreedingHow to Write a Powerful Resume for Career Development?
How to Write a Powerful Resume for Career Development?StrengthsTheatre
?
Master these resume techniques to present yourself with clarity, confidence, and professionalism. For a personality development course, visit - sanjeevdatta.comaaaaaaaaaaaaaaaaaaaaaaaaaaaaaaaaaaaaaaaaaaaaaaaaaaaaaaaaaaaaaaDigital-Literac...
aaaaaaaaaaaaaaaaaaaaaaaaaaaaaaaaaaaaaaaaaaaaaaaaaaaaaaaaaaaaaaDigital-Literac...RoyCerbasPaderes
?
aaaaaaaaaaaaaaaaaaaaaaaaaaaaaaaaaaaaaaaaaxzasdfgbhnjS Pomeroy - Resume - Financial Leadership Role ATSV2 (06 13 25).pdf
S Pomeroy - Resume - Financial Leadership Role ATSV2 (06 13 25).pdfndhsshare1
?
Seth Pomeroy, CPA, MIS
CFO | Controller | Financial Leadership | Financial Reporting | ERP Implementation | FP&A | Technical Accounting | MD&A | BI Dashboards | SaaS | Financial Services | Distribution | E-CommerceRuchi Bhatia HRGurukul - The Roads less travelled
Ruchi Bhatia HRGurukul - The Roads less travelledRuchi Bhatia
?
HR Consultant | Executive Coach | Founder ¨C HRGurukul | IIM, XLRI, IBM Alumna | Karmyogi
I started my career in sales with GSK, where I was one of the youngest executives to be promoted to the management cadre. Those five years taught me grit, persuasion, and the power of relationshipsˇŞskills that continue to shape my leadership style.
I then spent 12 transformative years at IBM in various HR rolesˇŞCorporate Trainer, Workforce Partner, Career Development Lead, L&D Consultant, and Employer Branding Leader. I was promoted five times in 12 years, earned IBMˇŻs Most Valuable Ambassador Award, and was trusted with high-impact roles that shaped people strategy for a global tech giant.
But the most life-changing moment was meeting Marshall Goldsmith in 2009ˇŞand being coached by him. It lit a fire in me to coach and empower others.
In 2016, I took a bold step. I left the corporate world to create HRGurukul, a platform to serve the HR community through consulting, coaching, and learning. Over the last 7 years, HRGurukul has grown into a trusted name in IndiaˇŻs HR ecosystem.
The pandemic years were personally challengingˇŞI battled depression. But I emerged stronger, guided by minimalism, purpose, and inner freedom (Vairagya). I returned with deeper empathy, clarity, and conviction in my mission.
Today, I wear multiple hatsˇŞwith one single purpose: to elevate the HR community.
? Recognition & Impact
Top 10 HR Influencer, Economic Times HRWorld (2025)
Top 20 HR Influencer, Economic Times HRWorld (2023, 2024)
Top 50 HR Leader, ETHRWorld (2021)
Recognized by SHRM, PeopleMatters, WeAce, NHRD, SheThePeople, Jombay
40 Under 40 Leader Award, Jombay (2018)
IBM Ambassador, Manager's Choice Awards, Rising Star
? Beliefs That Guide Me
ˇ°Vairagya is not running away from life. It is living life with deep purpose and inner freedom.ˇ±
Gratitude. Abundance. Win-Win Mindset.
Being a coach allows me to empower others to discover their best selves.
?? My Three Anchors
Health ¨C My most precious asset
Mission ¨C To serve the HR community
Relationships ¨C With family, friends, and the community that uplifts me
Revolutionizing Environmental Compliance with AI.pdf
Revolutionizing Environmental Compliance with AI.pdfDorian F Corliss
?
In the face of rising regulatory pressures and growing environmental concerns, industrial sectors must evolve. Traditional compliance approaches are no longer sufficient for meeting todayˇŻs complex sustainability goals. Dorian Corliss, a veteran environmental compliance expert with over 20 years of experience and two emissions technology patents, is at the forefront of this transformation. By integrating artificial intelligence into power, wastewater, and landfill operations, he is setting a new standard for smart, sustainable, and scalable environmental management.CISA Certification And Training online..
CISA Certification And Training online..Streling next pvt ltd
?
The Certified Information Systems Auditor (CISA) certification is a globally recognized credential for professionals specializing in information systems auditing, control, and security. Offered by ISACA, the CISA certification valognized credential for professionals specializing in information systems auditing, control, and security. Offered by ISACA, the CISA certification validates an individual's ability to assess vulnerabilities, report on compliance, and implement robust IT governance frameworks within an organization. With cyber threats evolving rapidly, businesses and government agencies increasingly seek certified professionals to safeguard critical information systems. The CISA exam covers five key domains: Information Systems Auditing, Governance and Management of IT, Information Systems Acquisition, Development and Implementation, Information Systems Operations and Business Resilience, and Protection of Information Assets. Passing the CISA exam demonstrates an individual's expertise in ensuring the integrity, confidentiality, and availability of information systems, making it a highly sought-after credential for IT auditors, security consultants, and risk management professionals. The CISA program not only equips individuals with technical auditing skills but also emphasizes a risk-based approach to IT security, ensuring organizations align their IT and business strategies. As businesses continue to invest in stronger cybersecurity frameworks to protect sensitive data, the CISA certification remains an essential credential for professionals looking to advance in the fields of IT auditing, governance, and risk management. Cost_Effective_Multi_Source_Energy_Harvesting_System1 final 5.pptx
Cost_Effective_Multi_Source_Energy_Harvesting_System1 final 5.pptxAnishNaskar4
?
Hhhhhhhhhdhdhdhddhjdhdj
? Top 11 IT Companies in Hinjewadi You Should Know About
? Top 11 IT Companies in Hinjewadi You Should Know Aboutvaishalitraffictail
?
Hinjewadi, Pune, has emerged as a leading IT hub in India, hosting top tech giants and driving digital transformation across industries. With companies like Infosys, TCS, Wipro, and Cognizant establishing a strong presence, Hinjewadi offers excellent career opportunities, modern infrastructure, and a thriving tech ecosystem. This article explores the Top 11 IT Companies in Hinjewadi, highlighting their innovations, impact, and why they are key players in India's IT landscape.Gives a structured overview of the skills measured in the DP-700 exam
Gives a structured overview of the skills measured in the DP-700 examthehulk1299
?
Title şÝşÝߣ ¨C Exam name and author/date
Exam Objectives ¨C Key knowledge domains (administration, monitoring, security)
Instance Administration ¨C Managing SQL instances, firewall rules, performance tuning
Database-Level Admin ¨C Tables, indexes, triggers, backups
Monitoring & High Availability ¨C Query Store, auto tuning, geo-replication
Security & Compliance ¨C RBAC, TDE, auditing
Tools & Services ¨C Azure Portal, SSMS, Azure Monitor
Exam Preparation Tips ¨C Learning paths, mock tests, community support
Resources ¨C Official docs, third-party sites, YouTube
Q&A şÝşÝߣWhat is UPSC job in India ? , Details about UPSC
What is UPSC job in India ? , Details about UPSCprathamdigitalmarket
?
This presentation helps you to understand what is UPSC in bullet points. If you want to know more click at the link. ×îĐ°ćĂŔąúĐÝËą¶Ů´óѧ±Ďҵ֤Ł¨±«±á±Ďҵ֤Ę飩԰涨ÖĆ
×îĐ°ćĂŔąúĐÝËą¶Ů´óѧ±Ďҵ֤Ł¨±«±á±Ďҵ֤Ę飩԰涨ÖĆTaqyea
?
ĽřÓÚ´ËŁ¬¶¨ÖĆĐÝËą¶Ů´óѧѧλ֤ĘéĚáÉýÂÄŔúˇľqޱ1954292140ˇżÔ°ć¸ß·ÂĐÝËą¶Ů´óѧ±Ďҵ֤(UH±Ďҵ֤Ęé)żÉĎČż´łÉĆ·Ńů±ľˇľqޱ1954292140ˇż°ďÄú˝âľöÔÚĂŔąúĐÝËą¶Ů´óѧδ±ĎҵÄŃĚ⣬ĂŔąú±Ďҵ֤ąşÂňŁ¬ĂŔąúÎÄĆľąşÂňŁ¬ˇľq΢1954292140ˇżĂŔąúÎÄĆľąşÂňŁ¬ĂŔąúÎÄĆľ¶¨ÖĆŁ¬ĂŔąúÎÄĆľ˛ą°ěˇŁ×¨ŇµÔÚĎ߶¨ÖĆĂŔąú´óѧÎÄĆľŁ¬¶¨×öĂŔąú±ľżĆÎÄĆľŁ¬ˇľq΢1954292140ˇż¸´ÖĆĂŔąúThe University of Houston completion letterˇŁÔÚĎßżěËٲą°ěĂŔąú±ľżĆ±Ďҵ֤ˇ˘Ë¶ĘżÎÄĆľÖ¤Ę飬ąşÂňĂŔąúѧλ֤ˇ˘ĐÝËą¶Ů´óѧOfferŁ¬ĂŔąú´óѧÎÄĆľÔÚĎßąşÂňˇŁ
ČçąűÄú´¦ÓÚŇÔĎÂĽ¸ÖÖÇéżöŁş
ˇóÔÚĐŁĆڼ䣬Ňň¸÷ÖÖÔŇňδÄÜËłŔű±ĎҵˇˇÄò»µ˝ąŮ·˝±Ďҵ֤
ˇóĂć¶Ô¸¸Ä¸µÄŃąÁ¦Ł¬ĎŁÍűľˇżěÄõ˝Ł»
ˇó˛»ÇĺłţČĎÖ¤Á÷łĚŇÔĽ°˛ÄÁϸĂČçşÎ׼±¸Ł»
ˇó»ŘąúʱĽäşÜł¤Ł¬ÍüĽÇ°ěŔíŁ»
ˇó»ŘąúÂíÉĎľÍŇŞŐŇą¤×÷Ł¬°ě¸řÓĂČ˵ĄÎ»ż´Ł»
ˇóĆóĘÂҵµĄÎ»±ŘĐëŇŞÇó°ěŔíµÄ
ˇóĐčŇŞ±¨żĽą«ÎńÔ±ˇ˘ąşÂňĂâË°łµˇ˘Âäת»§żÚ
ˇóÉęÇëÁôѧÉú´´Ňµ»ů˝đ
ˇľ¸´żĚŇ»Ě×ĐÝËą¶Ů´óѧ±Ďҵ֤łÉĽ¨µĄĐĹ·âµČ˛ÄÁĎ×îÇżąĄÂÔ,Buy The University of Houston Transcriptsˇż
ąşÂňČŐş«łÉĽ¨µĄˇ˘Ó˘ąú´óѧłÉĽ¨µĄˇ˘ĂŔąú´óѧłÉĽ¨µĄˇ˘°ÄÖŢ´óѧłÉĽ¨µĄˇ˘ĽÓÄĂ´ó´óѧłÉĽ¨µĄŁ¨q΢1954292140Ł©ĐÂĽÓĆ´óѧłÉĽ¨µĄˇ˘ĐÂÎ÷ŔĽ´óѧłÉĽ¨µĄˇ˘°®¶űŔĽłÉĽ¨µĄˇ˘Î÷°ŕŃŔłÉĽ¨µĄˇ˘µÂąúłÉĽ¨µĄˇŁłÉĽ¨µĄµÄŇâŇĺÖ÷ŇŞĚĺĎÖÔÚÖ¤Ă÷ѧϰÄÜÁ¦ˇ˘ĆŔąŔѧĘő±łľ°ˇ˘ŐąĘľ×ŰşĎËŘÖʡ˘Ěá¸ß¼ȡÂĘŁ¬ŇÔĽ°ĘÇ×÷ÎŞÁôĐĹČĎÖ¤ÉęÇë˛ÄÁϵÄŇ»˛ż·ÖˇŁ
ĐÝËą¶Ů´óѧłÉĽ¨µĄÄÜą»ĚĺĎÖÄúµÄµÄѧϰÄÜÁ¦Ł¬°üŔ¨ĐÝËą¶Ů´óѧżÎłĚłÉĽ¨ˇ˘×¨ŇµÄÜÁ¦ˇ˘ŃĐľżÄÜÁ¦ˇŁŁ¨q΢1954292140Ł©ľßĚĺŔ´ËµŁ¬łÉĽ¨±¨¸ćµĄÍ¨łŁ°üş¬Ń§ÉúµÄѧϰĽĽÄÜÓëĎ°ąßˇ˘¸÷żĆłÉĽ¨ŇÔĽ°ŔĎʦĆŔÓďµČ˛ż·ÖŁ¬Ňň´ËŁ¬łÉĽ¨µĄ˛»˝öĘÇѧÉúѧĘőÄÜÁ¦µÄÖ¤Ă÷Ł¬Ň˛ĘÇĆŔąŔѧÉúĘÇ·ńĘĘşĎÄł¸ö˝ĚÓýĎîÄżµÄÖŘŇŞŇŔľÝŁˇAd
XXXXXXX
- 1. Computer Studies P.5A Teacher: Mike Chui Date: January 19, 2015
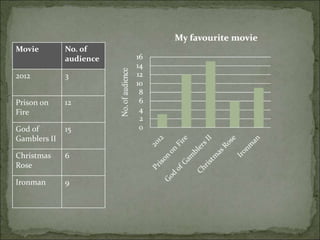
- 2. Movie No. of audience 2012 3 Prison on Fire 12 God of Gamblers II 15 Christmas Rose 6 Ironman 9
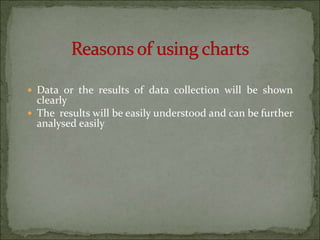
- 4. ? Data or the results of data collection will be shown clearly ? The results will be easily understood and can be further analysed easily
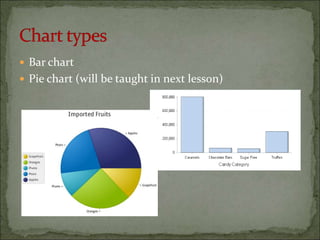
- 5. ? Bar chart ? Pie chart (will be taught in next lesson)
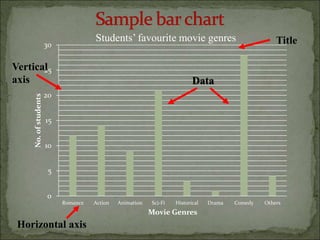
- 6. 0 5 10 15 20 25 30 Romance Action Animation Sci-Fi Historical Drama Comedy Others No.ofstudents Movie Genres Vertical axis Horizontal axis Title Data StudentsˇŻ favourite movie genres
- 7. ? Title ¨C StudentsˇŻ favourite movie genres ? Vertical axis ¨C No. of students ? Horizontal axis ¨C Movie genres ? Bar ¨C Data (i.e. No. of students for different movie genres)
- 8. 1. They make comparisons between different variables very easy to see. 2. They clearly show trends in data, meaning that they show how one variable is affected as the other rises or falls. 3. Given one variable, the value of the other can be easily determined.
- 9. Please watch the following short video clip for our discussion next lesson: