Composition and characteristics of integrated information systems. ERP-system as a corporate standard
Download as PPTX, PDF0 likes4 views

Composition and characteristics of integrated information systems. ERP-system as a corporate standard https://econ.biem.sumdu.edu.ua/


More Related Content
Similar to Composition and characteristics of integrated information systems. ERP-system as a corporate standard (20)
More from Department of Economics, Entrepreneurship and Business Administration, SumDU (20)


Composition and characteristics of integrated information systems. ERP-system as a corporate standard
- 1. Chapter 7: Composition and characteristics of integrated information systems. ERP-system as a corporate standard. ąóąĄą╝ą░ 7: ąĪą║ą╗ą░ą┤ č¢ čģą░čĆą░ą║č鹥čĆąĖčüčéąĖą║ą░ č¢ąĮč鹥ą│čĆąŠą▓ą░ąĮąĖčģ č¢ąĮč乊čĆą╝ą░čåč¢ą╣ąĮąĖčģ čüąĖčüč鹥ą╝. ERP- čüąĖčüč鹥ą╝ąĖ čÅą║ ą║ąŠčĆą┐ąŠčĆą░čéąĖą▓ąĮąĖą╣ čüčéą░ąĮą┤ą░čĆčé.
- 2. Integration - combining separate parts or functions of the system. Integrated information system - an open set of software and hardware that supports business processes and integrates data, functions and manufacturing processes into one. ąåąĮč鹥ą│čĆą░čåč¢čÅ - ąŠą▒'čöą┤ąĮą░ąĮąĮčÅ ąŠą║čĆąĄą╝ąĖčģ čćą░čüčéąĖąĮ ą░ą▒ąŠ čäčāąĮą║čåč¢ą╣ čüąĖčüč鹥ą╝ąĖ. ą¤č¢ą┤ č¢ąĮč鹥ą│čĆąŠą▓ą░ąĮąŠčÄ č¢ąĮč乊čĆą╝ą░čåč¢ą╣ąĮąŠčÄ čüąĖčüč鹥ą╝ąŠčÄ čĆąŠąĘčāą╝č¢čöčéčīčüčÅ ą▓č¢ą┤ą║čĆąĖčéąĖą╣ ą║ąŠą╝ą┐ą╗ąĄą║čü ą┐čĆąŠą│čĆą░ą╝ąĮąŠ- ą░ą┐ą░čĆą░čéąĮąĖčģ ąĘą░čüąŠą▒č¢ą▓, čēąŠ ą┐č¢ą┤čéčĆąĖą╝čāčö ą▒č¢ąĘąĮąĄčü-ą┐čĆąŠčåąĄčüąĖ č¢ ą┐ąŠčöą┤ąĮčāčö ą┤ą░ąĮč¢, čäčāąĮą║čåč¢čŚ čéą░ ą▓ąĖčĆąŠą▒ąĮąĖčćč¢ ą┐čĆąŠčåąĄčüąĖ ą▓ ąŠą┤ąĮąĄ čåč¢ą╗ąĄ.
- 3. Currently, the most popular of integrated information systems are ERP-systems class. ERP-system (Enterprise Resource Planning System) - the enterprise resource planning system, which is becoming world standard. ERP - the integrated system for planning and managing all resources of the company, its supply, sales, human resources and salaries, production, research and development work. ąÆ ą┤ą░ąĮąĖą╣ čćą░čü ąĮą░ą╣ą▒č¢ą╗čīčłčā ą┐ąŠą┐čāą╗čÅčĆąĮč¢čüčéčī čüąĄčĆąĄą┤ č¢ąĮč鹥ą│čĆąŠą▓ą░ąĮąĖčģ č¢ąĮč乊čĆą╝ą░čåč¢ą╣ąĮąĖčģ čüąĖčüč鹥ą╝ ąŠčéčĆąĖą╝ą░ą╗ąĖ čüąĖčüč鹥ą╝ąĖ ą║ą╗ą░čüčā ąĢRąĀ. ąĪąĖčüč鹥ą╝ą░ ERP (Enterprise Resource Planning System) - čüąĖčüč鹥ą╝ą░ ą┐ą╗ą░ąĮčāą▓ą░ąĮąĮčÅ čĆąĄčüčāčĆčüč¢ą▓ ą┐č¢ą┤ą┐čĆąĖčöą╝čüčéą▓ą░, čÅą║ą░ čüčéą░ą╗ą░ ą┐čĆąĄč鹥ąĮą┤čāą▓ą░čéąĖ ąĮą░ čüą▓č¢č鹊ą▓ąĖą╣ čüčéą░ąĮą┤ą░čĆčé. ERP - čåąĄ č¢ąĮč鹥ą│čĆąŠą▓ą░ąĮą░ čüąĖčüč鹥ą╝ą░, čēąŠ ąĘą░ą▒ąĄąĘą┐ąĄčćčāčö ą┐ą╗ą░ąĮčāą▓ą░ąĮąĮčÅ č¢ čāą┐čĆą░ą▓ą╗č¢ąĮąĮčÅ ą▓čüč¢ą╝ą░ čĆąĄčüčāčĆčüą░ą╝ąĖ ą┐č¢ą┤ą┐čĆąĖčöą╝čüčéą▓ą░, ą╣ąŠą│ąŠ ą┐ąŠčüčéą░čćą░ąĮąĮčÅą╝, ąĘą▒čāč鹊ą╝, ą║ą░ą┤čĆą░ą╝ąĖ č¢ ąĘą░čĆąŠą▒č¢čéąĮąŠčÄ ą┐ą╗ą░č鹊čÄ, ą▓ąĖčĆąŠą▒ąĮąĖčåčéą▓ąŠą╝, ąĮą░čāą║ąŠą▓ąŠ-ą┤ąŠčüą╗č¢ą┤ąĮąĖčåčīą║ąĖą╝ąĖ č¢ ą║ąŠąĮčüčéčĆčāą║č鹊čĆčüčīą║ąĖą╝ąĖ čĆąŠą▒ąŠčéą░ą╝ąĖ.
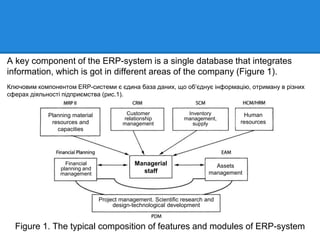
- 4. A key component of the ERP-system is a single database that integrates information, which is got in different areas of the company (Figure 1). ąÜą╗čÄč湊ą▓ąĖą╝ ą║ąŠą╝ą┐ąŠąĮąĄąĮč鹊ą╝ ERP-čüąĖčüč鹥ą╝ąĖ čö čöą┤ąĖąĮą░ ą▒ą░ąĘą░ ą┤ą░ąĮąĖčģ, čēąŠ ąŠą▒ŌĆśčöą┤ąĮčāčö č¢ąĮč乊čĆą╝ą░čåč¢čÄ, ąŠčéčĆąĖą╝ą░ąĮčā ą▓ čĆč¢ąĘąĮąĖčģ čüč乥čĆą░čģ ą┤č¢čÅą╗čīąĮąŠčüčéč¢ ą┐č¢ą┤ą┐čĆąĖčöą╝čüčéą▓ą░ (čĆąĖčü.1). Figure 1. The typical composition of features and modules of ERP-system Managerial staff Assets management Financial planning and management Planning material resources and capacities Customer relationship management Inventory management, supply Human resources Project management. Scientific research and design-technological development
- 5. ERP class systems, that are oriented on production, should allow to organize information support of most stages of the supply, production and sales, and financial planning accounting. Figure 2 shows a simplified typical minimum of ERP-system. ąĪąĖčüč鹥ą╝ąĖ ą║ą╗ą░čüčā ąĢRąĀ, ąŠčĆč¢čöąĮč鹊ą▓ą░ąĮč¢ ąĮą░ ą▓ąĖčĆąŠą▒ąĮąĖčåčéą▓ąŠ, ą┐ąŠą▓ąĖąĮąĮč¢ ą┤ąŠąĘą▓ąŠą╗čÅčéąĖ ąŠčĆą│ą░ąĮč¢ąĘčāą▓ą░čéąĖ č¢ąĮč乊čĆą╝ą░čåč¢ą╣ąĮąĖą╣ čüčāą┐čĆąŠą▓č¢ą┤ ą▒č¢ą╗čīčłąŠčüčéč¢ ąĄčéą░ą┐č¢ą▓ ą┐ąŠčüčéą░čćą░ąĮąĮčÅ, ą▓ąĖčĆąŠą▒ąĮąĖčåčéą▓ą░ č¢ čĆąĄą░ą╗č¢ąĘą░čåč¢čŚ ą┐čĆąŠą┤čāą║čåč¢čŚ, ą░ čéą░ą║ąŠąČ čäč¢ąĮą░ąĮčüąŠą▓ąĖą╣ ąŠą▒ą╗č¢ą║ ą┐ą╗ą░ąĮčāą▓ą░ąĮąĮčÅ. ąØą░ čĆąĖčü. 2 ą┐čĆąĄą┤čüčéą░ą▓ą╗ąĄąĮąĖą╣ čüą┐čĆąŠčēąĄąĮąĖą╣ čéąĖą┐ąŠą▓ąĖą╣ ą╝č¢ąĮč¢ą╝ą░ą╗čīąĮąĖą╣ čüą║ą╗ą░ą┤ ERP-čüąĖčüč鹥ą╝ąĖ. Figure 2. Simplified typical minimum of ERP-system Provider Consumer ERP-system Module of financial accounting and planning SCM-module MRP II-module CRM-module
- 6. In the practice of management, are widely common such software systems that are integrated within the framework of ERP-systems into a single one: ŌĆó SCM (Supply Chain Management); ŌĆó ąĪRą£ (Customer Relationship Management); ŌĆó ą£RąĀ ąåąå (Material Requirements Planning ąåąå). Includes ąĪRP (Capacity Requirements Planning), unlike the previous MRP 1; ŌĆó Module of financial accounting and planning. ąŻ ą┐čĆą░ą║čéąĖčåč¢ čāą┐čĆą░ą▓ą╗č¢ąĮąĮčÅ čłąĖčĆąŠą║ąŠą│ąŠ ą┐ąŠčłąĖčĆąĄąĮąĮčÅ ąĮą░ą▒čāą╗ąĖ čéą░ą║č¢ ą┐čĆąŠą│čĆą░ą╝ąĮč¢ čüąĖčüč鹥ą╝ąĖ, čēąŠ č¢ąĮč鹥ą│čĆčāčÄčéčīčüčÅ ą▓ čĆą░ą╝ą║ą░čģ ERP-čüąĖčüč鹥ą╝ ą▓ ąŠą┤ąĮąĄ čåč¢ą╗ąĄ: ŌĆó SCM (Supply Chain Management) - čāą┐čĆą░ą▓ą╗č¢ąĮąĮčÅ ą╗ą░ąĮčåčÄą│ą░ą╝ąĖ ą┐ąŠčüčéą░ą▓ąŠą║; ŌĆó ąĪRą£ (Customer Relationship Management) - čāą┐čĆą░ą▓ą╗č¢ąĮąĮčÅ ą▓ąĘą░čöą╝ąŠą▓č¢ą┤ąĮąŠčüąĖąĮą░ą╝ąĖ ąĘ ą║ą╗č¢čöąĮčéą░ą╝ąĖ; ŌĆó ą£RąĀ ąåąå (Material Requirements Planning ąåąå) - ą┐ą╗ą░ąĮčāą▓ą░ąĮąĮčÅ ą┐ąŠčéčĆąĄą▒ąĖ ą▓ ą╝ą░č鹥čĆč¢ą░ą╗ą░čģ. ąÆą║ą╗čÄčćą░čö ąĪRP (Capacity Requirements Planning) - ą┐ą╗ą░ąĮčāą▓ą░ąĮąĮčÅ ą┐ąŠčéčĆąĄą▒ąĖ čā ą▓ąĖčĆąŠą▒ąĮąĖčćąĖčģ ą┐ąŠčéčāąČąĮąŠčüčéčÅčģ, ąĮą░ ą▓č¢ą┤ą╝č¢ąĮčā ą▓č¢ą┤ ą┐ąŠą┐ąĄčĆąĄą┤ąĮčīąŠčŚ MRP 1); ŌĆó ą╝ąŠą┤čāą╗čī čäč¢ąĮą░ąĮčüąŠą▓ąŠą│ąŠ ąŠą▒ą╗č¢ą║čā č¢ ą┐ą╗ą░ąĮčāą▓ą░ąĮąĮčÅ.
- 7. On the central place is MRP II-system, whose main task is calculating the necessary materials and loading equipment for industrial technological route by the time his setting, stading, adjusting production plans, etc. SCM-system provides coordination and control of all supply chain participants. SCM-systems allow companies, that producing complex products, to organize the transfer of requirements to subcontractors, suppliers coordinate and plan production schedules for the rational use of production and warehouse space. ą”ąĄąĮčéčĆą░ą╗čīąĮąĄ ą╝č¢čüčåąĄ ąĘą░ą╣ą╝ą░čö ą£RąĀ ąåąå čüąĖčüč鹥ą╝ą░, ąŠčüąĮąŠą▓ąĮąĄ ąĘą░ą▓ą┤ą░ąĮąĮčÅ čÅą║ąŠčŚ ą┐ąŠą╗čÅą│ą░čö ą▓ čĆąŠąĘčĆą░čģčāąĮą║ą░čģ ąĮąĄąŠą▒čģč¢ą┤ąĮąĖčģ ą╝ą░č鹥čĆč¢ą░ą╗č¢ą▓ č¢ ąĘą░ą▓ą░ąĮčéą░ąČąĄąĮąĮčÅ čāčüčéą░čéą║čāą▓ą░ąĮąĮčÅ ą┐ąŠ ą▓ąĖčĆąŠą▒ąĮąĖčćąĖą╝ č鹥čģąĮąŠą╗ąŠą│č¢čćąĮąĖą╝ ą╝ą░čĆčłčĆčāčéą░ą╝ ąĘ čāčĆą░čģčāą▓ą░ąĮąĮčÅą╝ čćą░čüčā ąĮą░ ą╣ąŠą│ąŠ ą┐ąĄčĆąĄąĮą░ą╗ą░ą│ąŠą┤ąČąĄąĮąĮčÅ, ą┐čĆąŠčüč鹊čŚ, ą║ąŠčĆąĖą│čāą▓ą░ąĮąĮčÅ ą┐ą╗ą░ąĮč¢ą▓ ą▓ąĖčĆąŠą▒ąĮąĖčåčéą▓ą░ č¢ čé.ą┤. ąĪąĖčüč鹥ą╝ą░ SCM ąĘą░ą▒ąĄąĘą┐ąĄčćčāčö ą║ąŠąŠčĆą┤ąĖąĮą░čåč¢čÄ č¢ ą║ąŠąĮčéčĆąŠą╗čī ą▓čüč¢čģ čāčćą░čüąĮąĖą║č¢ą▓ ą╗ą░ąĮčåčĹȹ║ą░ ą┐ąŠčüčéą░čćą░ąĮąĮčÅ. SCM-čüąĖčüč鹥ą╝ąĖ ą┤ąŠąĘą▓ąŠą╗čÅčÄčéčī ą┐č¢ą┤ą┐čĆąĖčöą╝čüčéą▓ą░ą╝, čēąŠ ą▓ąĖą┐čāčüą║ą░čÄčéčī čüą║ą╗ą░ą┤ąĮčā ą┐čĆąŠą┤čāą║čåč¢čÄ, ąŠčĆą│ą░ąĮč¢ąĘčāą▓ą░čéąĖ ą┐ąĄčĆąĄą┤ą░čćčā ą▓ąĖą╝ąŠą│ čüčāą▒ą┐č¢ą┤čĆčÅą┤ąĮąĖą║ą░ą╝, ą║ąŠąŠčĆą┤ąĖąĮčāą▓ą░čéąĖ čĆąŠą▒ąŠčéčā ąĘ ą┐ąŠčüčéą░čćą░ą╗čīąĮąĖą║ą░ą╝ąĖ, ą░ čéą░ą║ąŠąČ ą┐ą╗ą░ąĮčāą▓ą░čéąĖ ą▓ąĖčĆąŠą▒ąĮąĖčćč¢ ą│čĆą░čäč¢ą║ąĖ ą┤ą╗čÅ čĆą░čåč¢ąŠąĮą░ą╗čīąĮąŠą│ąŠ ą▓ąĖą║ąŠčĆąĖčüčéą░ąĮąĮčÅ ą▓ąĖčĆąŠą▒ąĮąĖčćąĖčģ č¢ čüą║ą╗ą░ą┤čüčīą║ąĖčģ ą┐čĆąĖą╝č¢čēąĄąĮčī.
- 8. ąÜčĆč¢ą╝ ąŠčĆą│ą░ąĮč¢ąĘą░čåč¢čŚ čĆąŠą▒ąŠčéąĖ ąĘ ą┐ąŠčüčéą░čćą░ą╗čīąĮąĖą║ą░ą╝ąĖ ą▓ą░ąČą╗ąĖą▓ąĄ ą╝č¢čüčåąĄ ąĘą░ą╣ą╝ą░čö čĆąŠą▒ąŠčéą░ ąĘ ą║ą╗č¢čöąĮčéą░ą╝ąĖ. ąöą╗čÅ čåčīąŠą│ąŠ čüčéą▓ąŠčĆčÄčÄčéčīčüčÅ ąĪRą£-čüąĖčüč鹥ą╝ąĖ, čēąŠ ąĘą░ą▒ąĄąĘą┐ąĄčćčāčÄčéčī ą┐ąŠą▓ąĮąĖą╣ čåąĖą║ą╗ čüčāą┐čĆąŠą▓ąŠą┤čā ą║ą╗č¢čöąĮčéč¢ą▓. ąÆ ąŠčüąĮąŠą▓č¢ čéą░ą║ąŠą│ąŠ čĆąŠą┤čā čüąĖčüč鹥ą╝ ą╗ąĄąČąĖčéčī čöą┤ąĖąĮą░ ą▒ą░ąĘą░ ą┤ą░ąĮąĖčģ ą┐čĆąŠ ą┐ąŠč鹥ąĮčåč¢ą╣ąĮąĖčģ čéą░ čĆąĄą░ą╗čīąĮąĖčģ ą┐ąŠą║čāą┐čåč¢ą▓. ąōąŠą╗ąŠą▓ąĮą░ ą┐ąĄčĆąĄą▓ą░ą│ą░ CRM ą┐ąŠą╗čÅą│ą░čö ą▓ č¢ąĮč鹥ą│čĆą░čåč¢čŚ ą┐ąŠą║čāą┐čåčÅ ą▓ ą┐čĆąŠčåąĄčü ą▓ąĖčĆąŠą▒ąĮąĖčåčéą▓ą░. ŌĆó In addition to organizing work with suppliers, the important place is occupied by working with clients. ŌĆó To do this, are created CRM-systems, that providing full cycle of support customers. ŌĆó At the heart of such systems is the single database of potential and real customers. ŌĆó The main advantage of CRM is integration customer into the production process.
- 9. With the help of CRM-systems are carried out: 1. search and analysis of customer information; 2. market planning (for client groups are made proposals, are defined sales channels, etc.); 3. interaction with customers. Manufacturers can obtain significant benefits by receiving and processing information such as: ŌĆó marketing; ŌĆó customer service; ŌĆó research and design; ŌĆó after-sales service. ąŚą░ ą┤ąŠą┐ąŠą╝ąŠą│ąŠčÄ CRM-čüąĖčüč鹥ą╝ ąĘą┤č¢ą╣čüąĮčÄčöčéčīčüčÅ: 1. ą┐ąŠčłčāą║ č¢ ą░ąĮą░ą╗č¢ąĘ č¢ąĮč乊čĆą╝ą░čåč¢čŚ ą┐čĆąŠ ą║ą╗č¢čöąĮčéč¢ą▓; 2. ą┐ą╗ą░ąĮčāą▓ą░ąĮąĮčÅ čĆąĖąĮą║čā (ą┤ą╗čÅ ą│čĆčāą┐ ą║ą╗č¢čöąĮčéč¢ą▓ ą▓ąĖčĆąŠą▒ą╗čÅčÄčéčīčüčÅ ą┐čĆąŠą┐ąŠąĘąĖčåč¢čŚ, ą▓ąĖąĘąĮą░čćą░čÄčéčīčüčÅ ą║ą░ąĮą░ą╗ąĖ ą┐čĆąŠą┤ą░ąČčā č¢ čé.ą┤.); 3. ą▓ąĘą░čöą╝ąŠą┤č¢čÅ ąĘ ą║ą╗č¢čöąĮčéą░ą╝ąĖ. ąÆąĖčĆąŠą▒ąĮąĖą║ąĖ ą╝ąŠąČčāčéčī ąŠčéčĆąĖą╝ą░čéąĖ čüčāčéčéčöą▓č¢ ą┐ąĄčĆąĄą▓ą░ą│ąĖ ąĘą░ čĆą░čģčāąĮąŠą║ ąŠčéčĆąĖą╝ą░ąĮąĮčÅ č¢ ąŠą▒čĆąŠą▒ą║ąĖ čéą░ą║ąŠčŚ č¢ąĮč乊čĆą╝ą░čåč¢čŚ, čÅą║: ą╝ą░čĆą║ąĄčéąĖąĮą│; ąŠą▒čüą╗čāą│ąŠą▓čāą▓ą░ąĮąĮčÅ ą║ą╗č¢čöąĮčéč¢ą▓; ą┤ąŠčüą╗č¢ą┤ąČąĄąĮąĮčÅ č¢ ą║ąŠąĮčüčéčĆčāčÄą▓ą░ąĮąĮčÅ; ą┐č¢čüą╗čÅą┐čĆąŠą┤ą░ąČąĮąĄ ąŠą▒čüą╗čāą│ąŠą▓čāą▓ą░ąĮąĮčÅ.
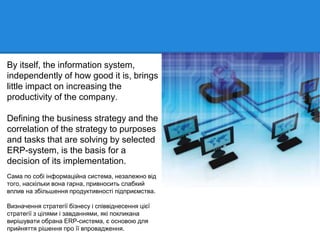
- 10. By itself, the information system, independently of how good it is, brings little impact on increasing the productivity of the company. Defining the business strategy and the correlation of the strategy to purposes and tasks that are solving by selected ERP-system, is the basis for a decision of its implementation. ąĪą░ą╝ą░ ą┐ąŠ čüąŠą▒č¢ č¢ąĮč乊čĆą╝ą░čåč¢ą╣ąĮą░ čüąĖčüč鹥ą╝ą░, ąĮąĄąĘą░ą╗ąĄąČąĮąŠ ą▓č¢ą┤ č鹊ą│ąŠ, ąĮą░čüą║č¢ą╗čīą║ąĖ ą▓ąŠąĮą░ ą│ą░čĆąĮą░, ą┐čĆąĖą▓ąĮąŠčüąĖčéčī čüą╗ą░ą▒ą║ąĖą╣ ą▓ą┐ą╗ąĖą▓ ąĮą░ ąĘą▒č¢ą╗čīčłąĄąĮąĮčÅ ą┐čĆąŠą┤čāą║čéąĖą▓ąĮąŠčüčéč¢ ą┐č¢ą┤ą┐čĆąĖčöą╝čüčéą▓ą░. ąÆąĖąĘąĮą░č湥ąĮąĮčÅ čüčéčĆą░č鹥ą│č¢čŚ ą▒č¢ąĘąĮąĄčüčā č¢ čüą┐č¢ą▓ą▓č¢ą┤ąĮąĄčüąĄąĮąĮčÅ čåč¢čöčŚ čüčéčĆą░č鹥ą│č¢čŚ ąĘ čåč¢ą╗čÅą╝ąĖ č¢ ąĘą░ą▓ą┤ą░ąĮąĮčÅą╝ąĖ, čÅą║č¢ ą┐ąŠą║ą╗ąĖą║ą░ąĮą░ ą▓ąĖčĆč¢čłčāą▓ą░čéąĖ ąŠą▒čĆą░ąĮą░ ERąĀ-čüąĖčüč鹥ą╝ą░, čö ąŠčüąĮąŠą▓ąŠčÄ ą┤ą╗čÅ ą┐čĆąĖą╣ąĮčÅčéčéčÅ čĆč¢čłąĄąĮąĮčÅ ą┐čĆąŠ čŚčŚ ą▓ą┐čĆąŠą▓ą░ą┤ąČąĄąĮąĮčÅ.