Building Dashboard with Excel
•Download as PPTX, PDF•
0 likes•146 views

Use Excel's PowerPivot, Pivot Table, PivotChart, and Slicer to build a dynamic dashboard in an hour to gain insight into an organization's operation and performance.


Building Dashboard with Excel
- 1. Dr. Vazi Okhandiar, DBA, MSCS, PMP, MCT www.nrclc.com. (714) 505-3475 Build a Dashboard in an Hour Using Microsoft PowerPivot in Excel NR Computer Learning Center
- 2. NR Computer Learning Center (NRCLC) •Established in 2002 •Provide Computer Training •Microsoft Partner  Hands-on classroom training  Online Training  Virtual Live Training  Private Lesson
- 3. Dr. Vazi Okhandiar Over 30 years of teaching experience in Computer Science & IT courses and Microsoft Products and working in IT industry. Worked for the World Bank, General Motors, HP/EDS, Toyota, CSC, Olympus, and Mitsubishi, as well as numerous small and medium-sized enterprises. Education: • DBA, Walden University • MBA, University of California, Irvine • Masters in Computer Science, Illinois Institute of Technology, Chicago • Bachelor’s Degree in Electrical Engineering, University of California, Irvine. Microsoft Certified Trainer (MCT) by Microsoft and Certified Project Management Professional (PMP) by PMI
- 4. Agenda • Introduction to dashboard • Import Raw Data in Power Pivot • Build Dashboard using Power Pivot • Q & A
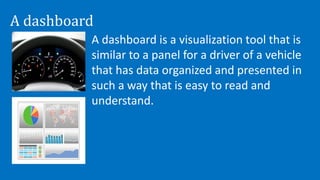
- 5. A dashboard A dashboard is a visualization tool that is similar to a panel for a driver of a vehicle that has data organized and presented in such a way that is easy to read and understand.
- 6. Benefit of Digital Dashboards • Visual presentation of performance measures • Ability to identify efficiencies/inefficiencies • Ability to identify and correct negative trends • Ability to identify new trends. • Ability to make more informed decision • Align strategies and organizational goals • Increase overall revenue
- 7. PowerPivot is a Free add-on for Microsoft Excel that enables a user to: • Import millions of row of data sources into a single Excel workbook • Create relationships between heterogeneous data • Create calculated columns and measures using formulas • Supports Visualize Tool – PivotTable, PivotChart, Slicers, Sparkline PowerPivot 7
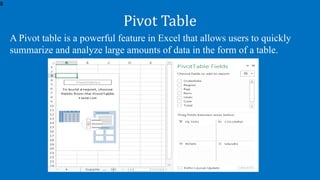
- 8. A Pivot table is a powerful feature in Excel that allows users to quickly summarize and analyze large amounts of data in the form of a table. Pivot Table 8
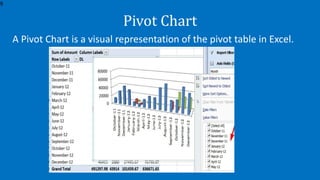
- 9. A Pivot Chart is a visual representation of the pivot table in Excel. Pivot Chart 9
- 10. Launching Power Pivot Launch PowerPivot tab on the Excel ribbon ď‚´Activate PowerPivot (File > Option > COM Add-in> Microsoft Office PowerPivot for Excel) 10
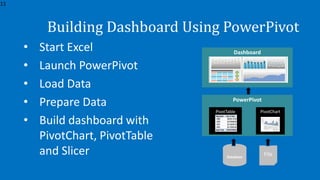
- 11. Building Dashboard Using PowerPivot • Start Excel • Launch PowerPivot • Load Data • Prepare Data • Build dashboard with PivotChart, PivotTable and Slicer Database File PowerPivot PivotTable 11 PivotChart Dashboard
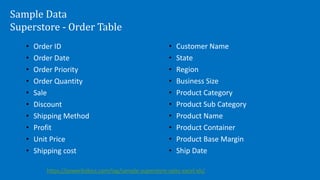
- 12. Sample Data Superstore - Order Table • Order ID • Order Date • Order Priority • Order Quantity • Sale • Discount • Shipping Method • Profit • Unit Price • Shipping cost • Customer Name • State • Region • Business Size • Product Category • Product Sub Category • Product Name • Product Container • Product Base Margin • Ship Date https://powerbidocs.com/tag/sample-superstore-sales-excel-xls/
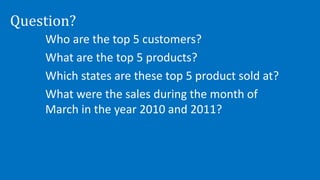
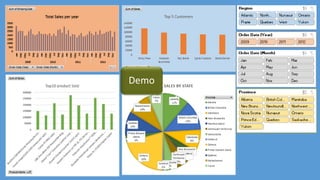
- 13. Question? Who are the top 5 customers? What are the top 5 products? Which states are these top 5 product sold at? What were the sales during the month of March in the year 2010 and 2011?