M.TECH final viva voice
Download as pptx, pdf2 likes650 views

This document provides information about a study on treating wastewater from a personal care products industry using the Fenton process. It begins with background on industrial wastewater generation and treatment in India. It then discusses the characteristics of wastewater from personal care products industries. The objectives of the study are outlined as characterizing the raw wastewater, evaluating the existing treatment plant, attempting to modify the process with Fenton treatment, and comparing treatment efficiencies and costs. Literature on Fenton treatment of various wastewaters is reviewed. Experimental methods, results, and future work are presented.


M.TECH final viva voice
- 1. TREATMENT OF WASTEWATER FROM A PERSONAL CARE PRODUCTS INDUSTRY BY FENTON PROCESS Phase II - Viva Voice Presented By GOKUL.D (CE1320) Under the Guidance of Dr. M.A.SIVASANKARAN, Professor Department of Civil Engineering Pondicherry Engineering College Puducherry – 605 014.
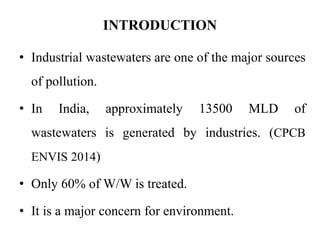
- 2. INTRODUCTION • Industrial wastewaters are one of the major sources of pollution. • In India, approximately 13500 MLD of wastewaters is generated by industries. (CPCB ENVIS 2014) • Only 60% of W/W is treated. • It is a major concern for environment.
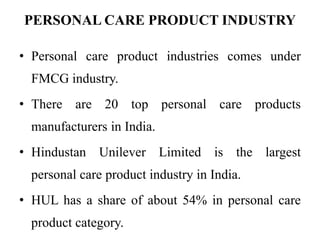
- 3. PERSONAL CARE PRODUCT INDUSTRY • Personal care product industries comes under FMCG industry. • There are 20 top personal care products manufacturers in India. • Hindustan Unilever Limited is the largest personal care product industry in India. • HUL has a share of about 54% in personal care product category.
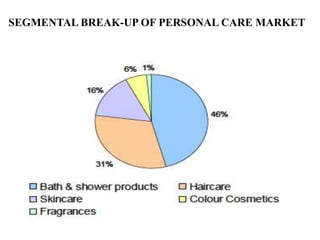
- 4. SEGMENTAL BREAK-UP OF PERSONAL CARE MARKET
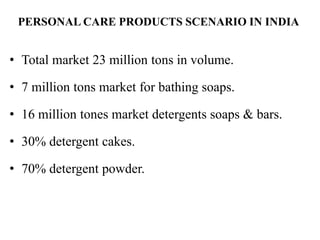
- 5. PERSONAL CARE PRODUCTS SCENARIO IN INDIA • Total market 23 million tons in volume. • 7 million tons market for bathing soaps. • 16 million tones market detergents soaps & bars. • 30% detergent cakes. • 70% detergent powder.
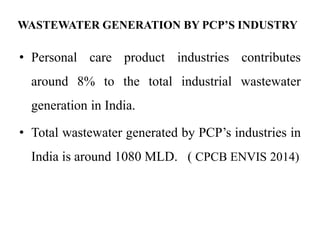
- 6. WASTEWATER GENERATION BY PCP’S INDUSTRY • Personal care product industries contributes around 8% to the total industrial wastewater generation in India. • Total wastewater generated by PCP’s industries in India is around 1080 MLD. ( CPCB ENVIS 2014)
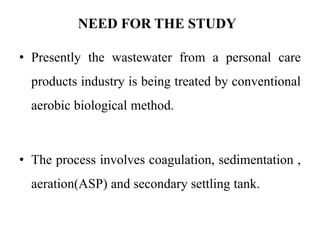
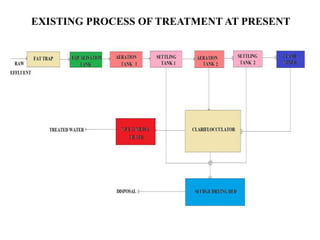
- 7. NEED FOR THE STUDY • Presently the wastewater from a personal care products industry is being treated by conventional aerobic biological method. • The process involves coagulation, sedimentation , aeration(ASP) and secondary settling tank.
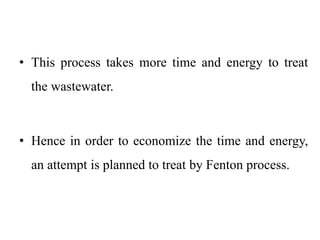
- 8. • This process takes more time and energy to treat the wastewater. • Hence in order to economize the time and energy, an attempt is planned to treat by Fenton process.
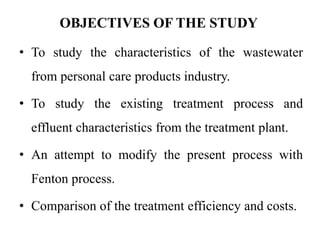
- 9. OBJECTIVES OF THE STUDY • To study the characteristics of the wastewater from personal care products industry. • To study the existing treatment process and effluent characteristics from the treatment plant. • An attempt to modify the present process with Fenton process. • Comparison of the treatment efficiency and costs.
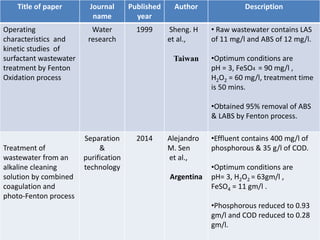
- 11. Title of paper Journal name Published year Author Description Operating characteristics and kinetic studies of surfactant wastewater treatment by Fenton Oxidation process Water research 1999 Sheng. H et al., Taiwan • Raw wastewater contains LAS of 11 mg/l and ABS of 12 mg/l. •Optimum conditions are pH = 3, FeSO4 = 90 mg/l , H2O2 = 60 mg/l, treatment time is 50 mins. •Obtained 95% removal of ABS & LABS by Fenton process. Treatment of wastewater from an alkaline cleaning solution by combined coagulation and photo-Fenton process Separation & purification technology 2014 Alejandro M. Sen et al., Argentina •Effluent contains 400 mg/l of phosphorous & 35 g/l of COD. •Optimum conditions are pH= 3, H2O2 = 63gm/l , FeSO4 = 11 gm/l . •Phosphorous reduced to 0.93 gm/l and COD reduced to 0.28 gm/l.
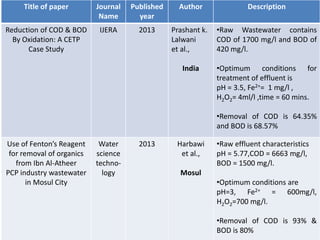
- 12. Title of paper Journal Name Published year Author Description Reduction of COD & BOD By Oxidation: A CETP Case Study IJERA 2013 Prashant k. Lalwani et al., India •Raw Wastewater contains COD of 1700 mg/l and BOD of 420 mg/l. •Optimum conditions for treatment of effluent is pH = 3.5, Fe2+= 1 mg/l , H2O2= 4ml/l ,time = 60 mins. •Removal of COD is 64.35% and BOD is 68.57% Use of Fenton’s Reagent for removal of organics from Ibn Al-Atheer PCP industry wastewater in Mosul City Water science techno- logy 2013 Harbawi et al., Mosul •Raw effluent characteristics pH = 5.77,COD = 6663 mg/l, BOD = 1500 mg/l. •Optimum conditions are pH=3, Fe2+ = 600mg/l, H2O2=700 mg/l. •Removal of COD is 93% & BOD is 80%
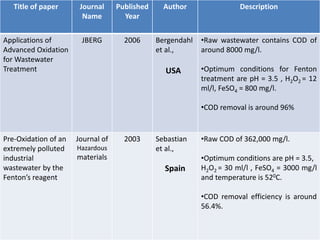
- 13. Title of paper Journal Name Published Year Author Description Applications of Advanced Oxidation for Wastewater Treatment JBERG 2006 Bergendahl et al., USA •Raw wastewater contains COD of around 8000 mg/l. •Optimum conditions for Fenton treatment are pH = 3.5 , H2O2 = 12 ml/l, FeSO4 = 800 mg/l. •COD removal is around 96% Pre-Oxidation of an extremely polluted industrial wastewater by the Fenton’s reagent Journal of Hazardous materials 2003 Sebastian et al., Spain •Raw COD of 362,000 mg/l. •Optimum conditions are pH = 3.5, H2O2 = 30 ml/l , FeSO4 = 3000 mg/l and temperature is 520C. •COD removal efficiency is around 56.4%.
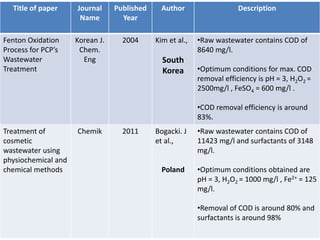
- 14. Title of paper Journal Name Published Year Author Description Fenton Oxidation Process for PCP’s Wastewater Treatment Korean J. Chem. Eng 2004 Kim et al., South Korea •Raw wastewater contains COD of 8640 mg/l. •Optimum conditions for max. COD removal efficiency is pH = 3, H2O2 = 2500mg/l , FeSO4 = 600 mg/l . •COD removal efficiency is around 83%. Treatment of cosmetic wastewater using physiochemical and chemical methods Chemik 2011 Bogacki. J et al., Poland •Raw wastewater contains COD of 11423 mg/l and surfactants of 3148 mg/l. •Optimum conditions obtained are pH = 3, H2O2 = 1000 mg/l , Fe2+ = 125 mg/l. •Removal of COD is around 80% and surfactants is around 98%
- 15. Time Line Phase 1 Work/ Month July August September October November December Literature Collection Sample collection & Testing Report preparation
- 17. 17 Experimental Scheme Experimental Scheme Phase 1 Phase 2 Collection of Effluent Modification of ETP Fenton treatment Process Evaluating COD removal efficiency Combined Fenton & ASP Cost benefit analysis
- 18. EXISTING PROCESS OF TREATMENT AT PRESENT
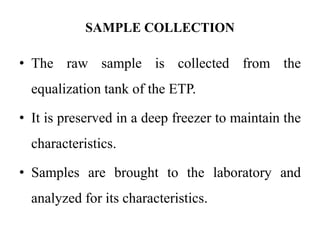
- 19. SAMPLE COLLECTION • The raw sample is collected from the equalization tank of the ETP. • It is preserved in a deep freezer to maintain the characteristics. • Samples are brought to the laboratory and analyzed for its characteristics.
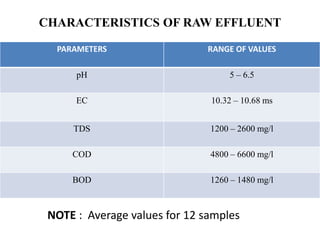
- 20. CHARACTERISTICS OF RAW EFFLUENT PARAMETERS RANGE OF VALUES pH 5 – 6.5 EC 10.32 – 10.68 ms TDS 1200 – 2600 mg/l COD 4800 – 6600 mg/l BOD 1260 – 1480 mg/l NOTE : Average values for 12 samples
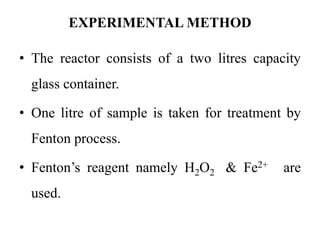
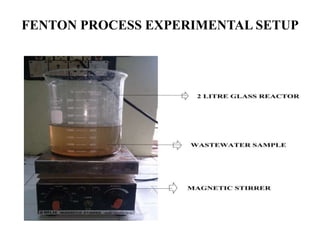
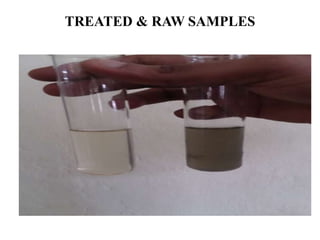
- 21. EXPERIMENTAL METHOD • The reactor consists of a two litres capacity glass container. • One litre of sample is taken for treatment by Fenton process. • Fenton’s reagent namely H2O2 & Fe2+ are used.
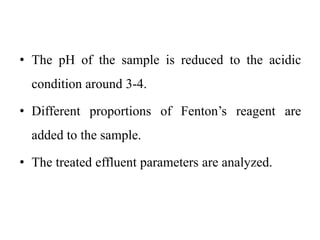
- 22. • The pH of the sample is reduced to the acidic condition around 3-4. • Different proportions of Fenton’s reagent are added to the sample. • The treated effluent parameters are analyzed.
- 23. FENTON PROCESS EXPERIMENTAL SETUP
- 25. TREATED & RAW SAMPLES
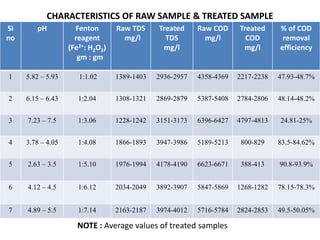
- 26. CHARACTERISTICS OF RAW SAMPLE & TREATED SAMPLE Si no pH Fenton reagent (Fe2+: H2O2) gm : gm Raw TDS mg/l Treated TDS mg/l Raw COD mg/l Treated COD mg/l % of COD removal efficiency 1 5.82 – 5.93 1:1.02 1389-1403 2936-2957 4358-4369 2217-2238 47.93-48.7% 2 6.15 – 6.43 1:2.04 1308-1321 2869-2879 5387-5408 2784-2806 48.14-48.2% 3 7.23 – 7.5 1:3.06 1228-1242 3151-3173 6396-6427 4797-4813 24.81-25% 4 3.78 – 4.05 1:4.08 1866-1893 3947-3986 5189-5213 800-829 83.5-84.62% 5 2.63 – 3.5 1:5.10 1976-1994 4178-4190 6623-6671 388-413 90.8-93.9% 6 4.12 – 4.5 1:6.12 2034-2049 3892-3907 5847-5869 1268-1282 78.15-78.3% 7 4.89 – 5.5 1:7.14 2163-2187 3974-4012 5716-5784 2824-2853 49.5-50.05% NOTE : Average values of treated samples
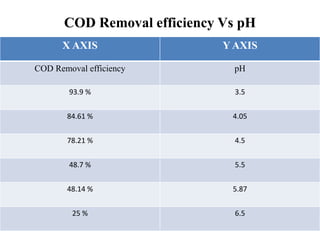
- 27. COD Removal efficiency Vs pH X AXIS Y AXIS COD Removal efficiency pH 93.9 % 3.5 84.61 % 4.05 78.21 % 4.5 48.7 % 5.5 48.14 % 5.87 25 % 6.5
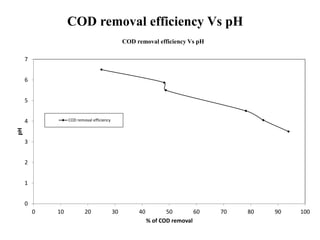
- 28. COD removal efficiency Vs pH 0 1 2 3 4 5 6 7 0 10 20 30 40 50 60 70 80 90 100 pH % of COD removal COD removal efficiency Vs pH COD removal efficiency
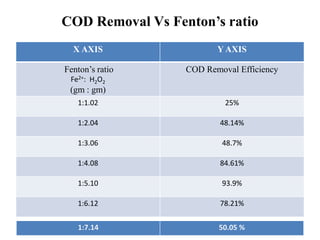
- 29. COD Removal Vs Fenton’s ratio X AXIS Y AXIS Fenton’s ratio Fe2+: H2O2 (gm : gm) COD Removal Efficiency 1:1.02 25% 1:2.04 48.14% 1:3.06 48.7% 1:4.08 84.61% 1:5.10 93.9% 1:6.12 78.21% 1:7.14 50.05 %
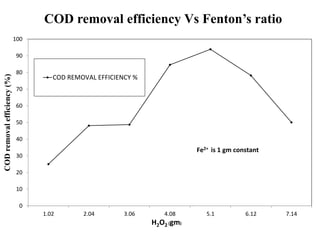
- 30. COD removal efficiency Vs Fenton’s ratio 0 10 20 30 40 50 60 70 80 90 100 1.02 2.04 3.06 4.08 5.1 6.12 7.14 CODremovalefficiency(%) H2O2 (gm) COD REMOVAL EFFICIENCY % Fe2+ is 1 gm constant
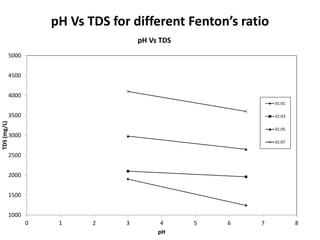
- 31. pH Vs TDS for different Fenton’s ratio 1000 1500 2000 2500 3000 3500 4000 4500 5000 0 1 2 3 4 5 6 7 8 TDS(mg/L) pH pH Vs TDS 01:01 01:03 01:05 01:07
- 32. FUTURE WORK • The cost estimation for the experimental work will be carried out in phase 2. • Methods will be adopted for reduction in TDS level.
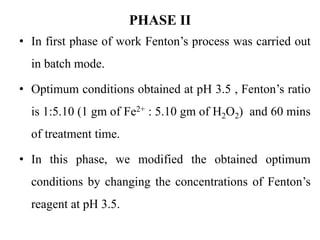
- 33. PHASE II • In first phase of work Fenton’s process was carried out in batch mode. • Optimum conditions obtained at pH 3.5 , Fenton’s ratio is 1:5.10 (1 gm of Fe2+ : 5.10 gm of H2O2) and 60 mins of treatment time. • In this phase, we modified the obtained optimum conditions by changing the concentrations of Fenton’s reagent at pH 3.5.
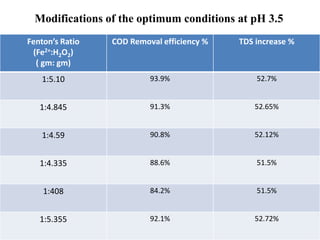
- 34. Modifications of the optimum conditions at pH 3.5 Fenton’s Ratio (Fe2+:H2O2) ( gm: gm) COD Removal efficiency % TDS increase % 1:5.10 93.9% 52.7% 1:4.845 91.3% 52.65% 1:4.59 90.8% 52.12% 1:4.335 88.6% 51.5% 1:408 84.2% 51.5% 1:5.355 92.1% 52.72%
- 35. HUL Requirements • According to the HUL suggestions, the pH of the raw effluent will be kept constant at the incoming pH 5. • Only the concentrations of the Fenton’s reagent will be varied to get the optimum COD removal at pH 5. • The optimum Fenton’s reagent and COD removal efficiency is calculated at pH 5.
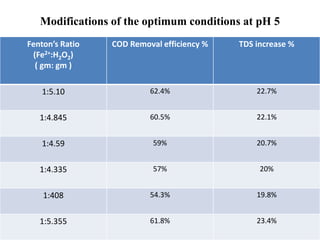
- 36. Modifications of the optimum conditions at pH 5 Fenton’s Ratio (Fe2+:H2O2) ( gm: gm ) COD Removal efficiency % TDS increase % 1:5.10 62.4% 22.7% 1:4.845 60.5% 22.1% 1:4.59 59% 20.7% 1:4.335 57% 20% 1:408 54.3% 19.8% 1:5.355 61.8% 23.4%
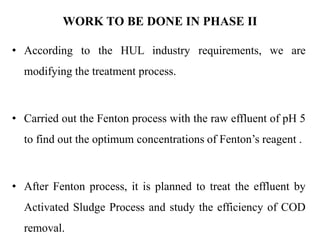
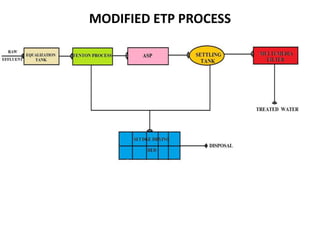
- 37. WORK TO BE DONE IN PHASE II • According to the HUL industry requirements, we are modifying the treatment process. • Carried out the Fenton process with the raw effluent of pH 5 to find out the optimum concentrations of Fenton’s reagent . • After Fenton process, it is planned to treat the effluent by Activated Sludge Process and study the efficiency of COD removal.
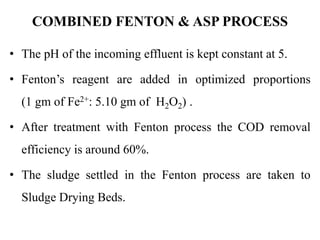
- 38. COMBINED FENTON & ASP PROCESS • The pH of the incoming effluent is kept constant at 5. • Fenton’s reagent are added in optimized proportions (1 gm of Fe2+: 5.10 gm of H2O2) . • After treatment with Fenton process the COD removal efficiency is around 60%. • The sludge settled in the Fenton process are taken to Sludge Drying Beds.
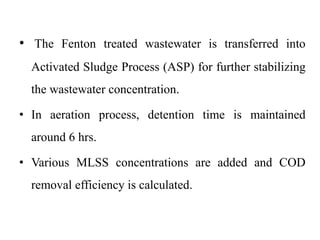
- 39. • The Fenton treated wastewater is transferred into Activated Sludge Process (ASP) for further stabilizing the wastewater concentration. • In aeration process, detention time is maintained around 6 hrs. • Various MLSS concentrations are added and COD removal efficiency is calculated.
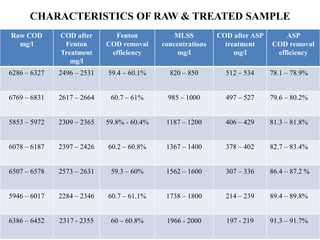
- 42. CHARACTERISTICS OF RAW & TREATED SAMPLE Raw COD mg/l COD after Fenton Treatment mg/l Fenton COD removal efficiency MLSS concentrations mg/l COD after ASP treatment mg/l ASP COD removal efficiency 6286 – 6327 2496 – 2531 59.4 – 60.1% 820 – 850 512 – 534 78.1 – 78.9% 6769 – 6831 2617 – 2664 60.7 – 61% 985 – 1000 497 – 527 79.6 – 80.2% 5853 – 5972 2309 – 2365 59.8% - 60.4% 1187 – 1200 406 – 429 81.3 – 81.8% 6078 – 6187 2397 – 2426 60.2 – 60.8% 1367 – 1400 378 – 402 82.7 – 83.4% 6507 – 6578 2573 – 2631 59.3 – 60% 1562 – 1600 307 – 336 86.4 – 87.2 % 5946 – 6017 2284 – 2346 60.7 – 61.1% 1738 – 1800 214 – 239 89.4 – 89.8% 6386 – 6452 2317 - 2355 60 – 60.8% 1966 - 2000 197 - 219 91.3 – 91.7%
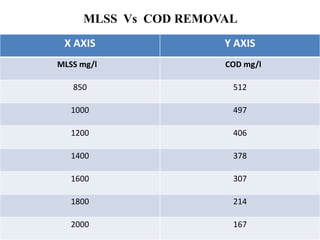
- 43. MLSS Vs COD REMOVAL X AXIS Y AXIS MLSS mg/l COD mg/l 850 512 1000 497 1200 406 1400 378 1600 307 1800 214 2000 167
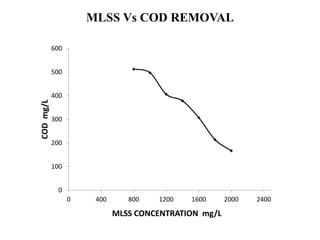
- 44. MLSS Vs COD REMOVAL 0 100 200 300 400 500 600 0 400 800 1200 1600 2000 2400 CODmg/L MLSS CONCENTRATION mg/L
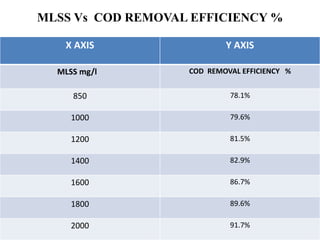
- 45. MLSS Vs COD REMOVAL EFFICIENCY % X AXIS Y AXIS MLSS mg/l COD REMOVAL EFFICIENCY % 850 78.1% 1000 79.6% 1200 81.5% 1400 82.9% 1600 86.7% 1800 89.6% 2000 91.7%
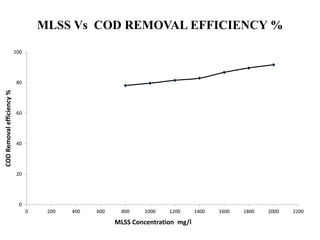
- 46. MLSS Vs COD REMOVAL EFFICIENCY % 0 20 40 60 80 100 0 200 400 600 800 1000 1200 1400 1600 1800 2000 2200 CODRemovalefficiency% MLSS Concentration mg/l
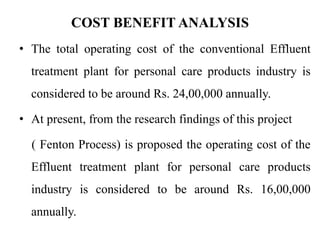
- 47. COST BENEFIT ANALYSIS • The total operating cost of the conventional Effluent treatment plant for personal care products industry is considered to be around Rs. 24,00,000 annually. • At present, from the research findings of this project ( Fenton Process) is proposed the operating cost of the Effluent treatment plant for personal care products industry is considered to be around Rs. 16,00,000 annually.
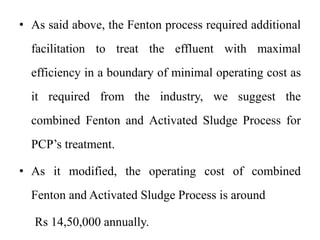
- 48. • As said above, the Fenton process required additional facilitation to treat the effluent with maximal efficiency in a boundary of minimal operating cost as it required from the industry, we suggest the combined Fenton and Activated Sludge Process for PCP’s treatment. • As it modified, the operating cost of combined Fenton and Activated Sludge Process is around Rs 14,50,000 annually.
- 49. • It is concluded and suggested from the findings of this project that the cost of the conventional treatment process is more when compared with the Fenton Process.
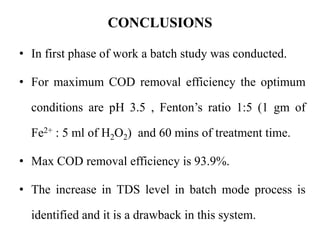
- 50. CONCLUSIONS • In first phase of work a batch study was conducted. • For maximum COD removal efficiency the optimum conditions are pH 3.5 , Fenton’s ratio 1:5 (1 gm of Fe2+ : 5 ml of H2O2) and 60 mins of treatment time. • Max COD removal efficiency is 93.9%. • The increase in TDS level in batch mode process is identified and it is a drawback in this system.
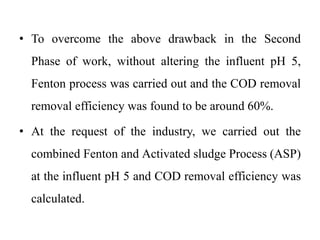
- 51. • To overcome the above drawback in the Second Phase of work, without altering the influent pH 5, Fenton process was carried out and the COD removal removal efficiency was found to be around 60%. • At the request of the industry, we carried out the combined Fenton and Activated sludge Process (ASP) at the influent pH 5 and COD removal efficiency was calculated.
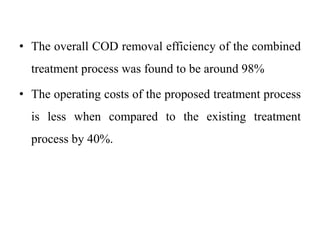
- 52. • The overall COD removal efficiency of the combined treatment process was found to be around 98% • The operating costs of the proposed treatment process is less when compared to the existing treatment process by 40%.
- 53. Time Line Phase II Work/ Month January February March April May Literature Collection Sample collection & Testing Report preparation
- 54. THANK YOU