Banglai candlesticks pattern er sohoj path
10 likes25,937 views

Bangla candlestick chart pattern

Banglai candlesticks pattern er sohoj path
- 1. evsjvq Candlesticks Pattern Gi mnR cvV Zvbfxi Avn‡g`
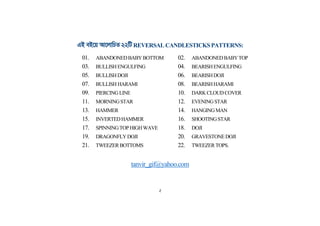
- 2. GB eB‡q Av‡jvwPZ22wUREVERSAL CANDLESTICKSPATTERNS: 01. ABANDONEDBABYBOTTOM 02. ABANDONEDBABYTOP 03. BULLISHENGULFING 04. BEARISHENGULFING 05. BULLISHDOJI 06. BEARISHDOJI 07. BULLISH HARAMI 08. BEARISHHARAMI 09. PIERCINGLINE 10. DARKCLOUDCOVER 11. MORNINGSTAR 12. EVENINGSTAR 13. HAMMER 14. HANGINGMAN 15. INVERTEDHAMMER 16. SHOOTINGSTAR 17. SPINNINGTOPHIGHWAVE 18. DOJI 19. DRAGONFLYDOJI 20. GRAVESTONEDOJI 21. TWEEZERBOTTOMS 22. TWEEZERTOPS. tanvir_gif@yahoo.com ২
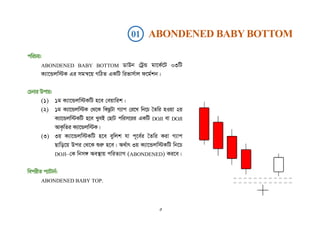
- 3. 01 ABONDENED BABY BOTTOM cwiPq: ABONDENED BABY BOTTOM WvDb †UªÛ gv‡K©‡U 03wU K¨v‡Ûjw÷K Gi mgš^‡q MwVZ GKwU wifvm©vj d‡g©kb| †Pbvi Dcvq: (1) 1g K¨v‡Ûjw÷KwU n‡e †eqvwik| (2) 1g K¨v‡Ûjw÷K †_‡K wKQzUv M¨vc †i‡L wb‡P ˆZwi nIqv 2q K¨v‡Ûjw÷KwU n‡e LyeB †QvU cwim‡ii GKwU DOJI ev DOJI AvK…wZi K¨v‡Ûjw÷K| (3) 3q K¨v‡Ûjw÷KwU n‡e eywjk hv c~‡e©i ˆZwi Kiv M¨vc Qvwo‡q Dci †_‡K ïiæ n‡e| A_©vr 3q K¨v‡Ûjw÷KwU wb‡P DOJI–†K wbm½ Ae¯’vq cwiZ¨vM (ABONDENED) Ki‡e| wecixZ c¨vUvb©: ABONDENED BABY TOP. ৩
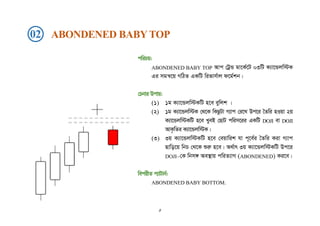
- 4. 02 ABONDENED BABYTOP cwiPq: ABONDENED BABY TOP Avc †UªÛ gv‡K©‡U 03wU K¨v‡Ûjw÷K Gi mgš^‡q MwVZ GKwU wifvm©vj d‡g©kb| †Pbvi Dcvq: (1) 1g K¨v‡Ûjw÷KwU n‡e eywjk | (2) 1g K¨v‡Ûjw÷K †_‡K wKQzUv M¨vc †i‡L Dc‡i ˆZwi nIqv 2q K¨v‡Ûjw÷KwU n‡e LyeB †QvU cwim‡ii GKwU DOJI ev DOJI AvK…wZi K¨v‡Ûjw÷K| (3) 3q K¨v‡Ûjw÷KwU n‡e †eqvwik hv c~‡e©i ˆZwi Kiv M¨vc Qvwo‡q wbP †_‡K ïiæ n‡e| A_©vr 3q K¨v‡Ûjw÷KwU Dc‡i DOJI–†K wbm½ Ae¯’vq cwiZ¨vM (ABONDENED) Ki‡e| wecixZ c¨vUvb©: ABONDENED BABY BOTTOM. ৪
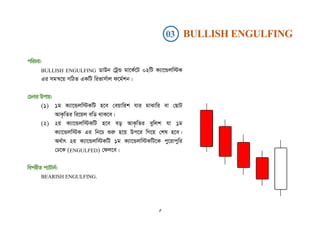
- 5. 03 BULLISH ENGULFING cwiPq: BULLISH ENGULFING WvDb †UªÛ gv‡K©‡U 02wU K¨v‡Ûjw÷K Gi mgš^‡q MwVZ GKwU wifvm©vj d‡g©kb| †Pbvi Dcvq: (1) 1g K¨v‡Ûjw÷KwU n‡e †eqvwik hvi gvSvwi ev †QvU AvK…wZi wi‡qj ewW _vK‡e| (2) 2q K¨v‡Ûjw÷KwU n‡e eo AvK…wZi eywjk hv 1g K¨v‡Ûjw÷K Gi wb‡P ïiæ n‡q Dc‡i wM‡q †kl n‡e| A_©vr 2q K¨v‡Ûjw÷KwU 1g K¨v‡Ûjw÷KwU‡K cy‡ivcywi †X‡K (ENGULFED) †dj‡e| wecixZ c¨vUvb©: BEARISH ENGULFING. ৫
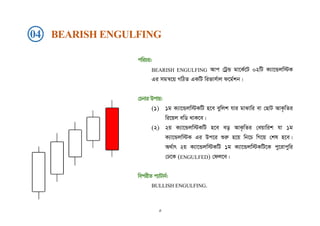
- 6. 04 BEARISH ENGULFING cwiPq: BEARISH ENGULFING Avc †UªÛ gv‡K©‡U 02wU K¨v‡Ûjw÷K Gi mgš^‡q MwVZ GKwU wifvm©vj d‡g©kb| †Pbvi Dcvq: (1) 1g K¨v‡Ûjw÷KwU n‡e eywjk hvi gvSvwi ev †QvU AvK…wZi wi‡qj ewW _vK‡e| (2) 2q K¨v‡Ûjw÷KwU n‡e eo AvK…wZi †eqvwik hv 1g K¨v‡Ûjw÷K Gi Dc‡i ïiæ n‡q wb‡P wM‡q †kl n‡e| A_©vr 2q K¨v‡Ûjw÷KwU 1g K¨v‡Ûjw÷KwU‡K cy‡ivcywi †X‡K (ENGULFED) †dj‡e| wecixZ c¨vUvb©: BULLISH ENGULFING. ৬
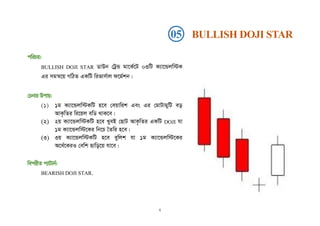
- 7. cwiPq: BULLISH DOJI STAR WvDb †UªÛ gv‡K©‡U 03wU K¨v‡Ûjw÷K Gi mgš^‡q MwVZ GKwU wifvm©vj d‡g©kb| †Pbvi Dcvq: (1) 1g K¨v‡Ûjw÷KwU n‡e †eqvwik Ges Gi †gvUvgywU eo AvK…wZi wi‡qj ewW _vK‡e| (2) 2q K¨v‡Ûjw÷KwU n‡e LyeB †QvU AvK…wZi GKwU DOJI hv 1g K¨v‡Ûjw÷‡Ki wb‡P ˆZwi n‡e| (3) 3q K¨v‡Ûjw÷KwU n‡e eywjk hv 1g K¨v‡Ûjw÷‡Ki A‡a©‡KiI †ewk Qvwo‡q hv‡e| wecixZ c¨vUvb©: BEARISH DOJI STAR. 05 BULLISH DOJI STAR ৭
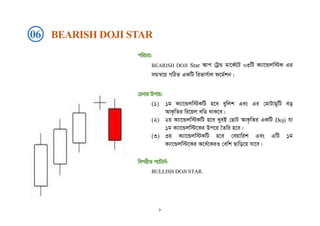
- 8. cwiPq: BEARISH DOJI Star Avc †UªÛ gv‡K©‡U 03wU K¨v‡Ûjw÷K Gi mgš^‡q MwVZ GKwU wifvm©vj d‡g©kb| †Pbvi Dcvq: (1) 1g K¨v‡Ûjw÷KwU n‡e eywjk Ges Gi †gvUvgywU eo AvK…wZi wi‡qj ewW _vK‡e| (2) 2q K¨v‡Ûjw÷KwU n‡e LyeB †QvU AvK…wZi GKwU Doji hv 1g K¨v‡Ûjw÷‡Ki Dc‡i ˆZwi n‡e| (3) 3q K¨v‡Ûjw÷KwU n‡e †eqvwik Ges GwU 1g K¨v‡Ûjw÷‡Ki A‡a©‡KiI †ewk Qvwo‡q hv‡e| wecixZ c¨vUvb©: BULLISH DOJI STAR. 06 BEARISH DOJI STAR ৮
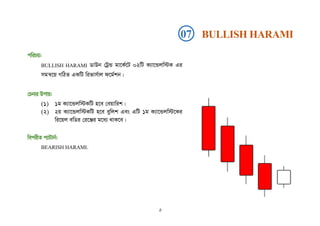
- 9. cwiPq: BULLISH HARAMI WvDb †UªÛ gv‡K©‡U 02wU K¨v‡Ûjw÷K Gi mgš^‡q MwVZ GKwU wifvm©vj d‡g©kb| †Pbvi Dcvq: (1) 1g K¨v‡Ûjw÷KwU n‡e †eqvwik| (2) 2q K¨v‡Ûjw÷KwU n‡e eywjk Ges GwU 1g K¨v‡Ûjw÷‡Ki wi‡qj ewWi †i‡Äi g‡a¨ _vK‡e| wecixZ c¨vUvb©: BEARISH HARAMI. 07 BULLISH HARAMI ৯
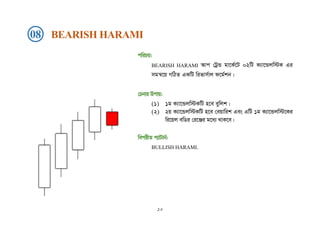
- 10. cwiPq: BEARISH HARAMI Avc †UªÛ gv‡K©‡U 02wU K¨v‡Ûjw÷K Gi mgš^‡q MwVZ GKwU wifvm©vj d‡g©kb| †Pbvi Dcvq: (1) 1g K¨v‡Ûjw÷KwU n‡e eywjk| (2) 2q K¨v‡Ûjw÷KwU n‡e †eqvwik Ges GwU 1g K¨v‡Ûjw÷‡Ki wi‡qj ewWi †i‡Äi g‡a¨ _vK‡e| wecixZ c¨vUvb©: BULLISH HARAMI. 08 BEARISH HARAMI ১০
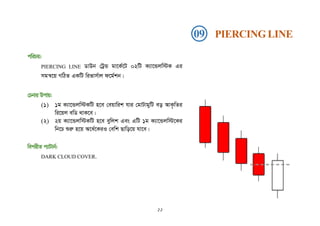
- 11. cwiPq: PIERCING LINE WvDb †UªÛ gv‡K©‡U 02wU K¨v‡Ûjw÷K Gi mgš^‡q MwVZ GKwU wifvm©vj d‡g©kb| †Pbvi Dcvq: (1) 1g K¨v‡Ûjw÷KwU n‡e †eqvwik hvi †gvUvgywU eo AvK…wZi wi‡qj ewW _vK‡e| (2) 2q K¨v‡Ûjw÷KwU n‡e eywjk Ges GwU 1g K¨v‡Ûjw÷‡Ki wb‡P ïiæ n‡q A‡a©‡KiI †ewk Qvwo‡q hv‡e| wecixZ c¨vUvb©: DARK CLOUD COVER. 09 PIERCING LINE ১১
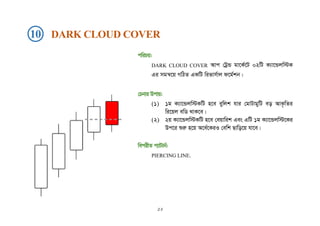
- 12. cwiPq: DARK CLOUD COVER Avc †UªÛ gv‡K©‡U 02wU K¨v‡Ûjw÷K Gi mgš^‡q MwVZ GKwU wifvm©vj d‡g©kb| †Pbvi Dcvq: (1) 1g K¨v‡Ûjw÷KwU n‡e eywjk hvi †gvUvgywU eo AvK…wZi wi‡qj ewW _vK‡e| (2) 2q K¨v‡Ûjw÷KwU n‡e †eqvwik Ges GwU 1g K¨v‡Ûjw÷‡Ki Dc‡i ïiæ n‡q A‡a©‡KiI †ewk Qvwo‡q hv‡e| wecixZ c¨vUvb©: PIERCING LINE. 10 DARK CLOUD COVER ১২
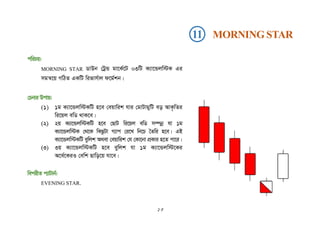
- 13. cwiPq: MORNING STAR WvDb †UªÛ gv‡K©‡U 03wU K¨v‡Ûjw÷K Gi mgš^‡q MwVZ GKwU wifvm©vj d‡g©kb| †Pbvi Dcvq: (1) 1g K¨v‡Ûjw÷KwU n‡e †eqvwik hvi †gvUvgywU eo AvK…wZi wi‡qj ewW _vK‡e| (2) 2q K¨v‡Ûjw÷KwU n‡e †QvU wi‡qj ewW m¤úbœ hv 1g K¨v‡Ûjw÷K †_‡K wKQzUv M¨vc †i‡L wb‡P ˆZwi n‡e| GB K¨v‡Ûjw÷KwU eywjk A_ev †eqvwik †h †Kv‡bv cÖKvi n‡Z cv‡i| (3) 3q K¨v‡Ûjw÷KwU n‡e eywjk hv 1g K¨v‡Ûjw÷‡Ki A‡a©‡KiI †ewk Qvwo‡q hv‡e| wecixZ c¨vUvb©: EVENING STAR. 11 MORNING STAR ১৩
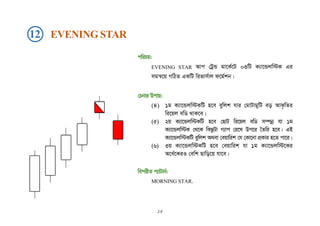
- 14. cwiPq: EVENING STAR Avc †UªÛ gv‡K©‡U 03wU K¨v‡Ûjw÷K Gi mgš^‡q MwVZ GKwU wifvm©vj d‡g©kb| †Pbvi Dcvq: (4) 1g K¨v‡Ûjw÷KwU n‡e eywjk hvi †gvUvgywU eo AvK…wZi wi‡qj ewW _vK‡e| (5) 2q K¨v‡Ûjw÷KwU n‡e †QvU wi‡qj ewW m¤úbœ hv 1g K¨v‡Ûjw÷K †_‡K wKQzUv M¨vc †i‡L Dc‡i ˆZwi n‡e| GB K¨v‡Ûjw÷KwU eywjk A_ev †eqvwik †h †Kv‡bv cÖKvi n‡Z cv‡i| (6) 3q K¨v‡Ûjw÷KwU n‡e †eqvwik hv 1g K¨v‡Ûjw÷‡Ki A‡a©‡KiI †ewk Qvwo‡q hv‡e| wecixZ c¨vUvb©: MORNING STAR. 12 EVENING STAR ১৪
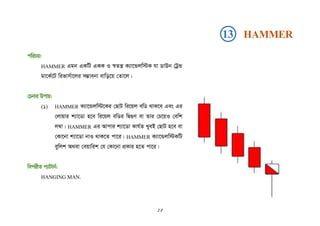
- 15. cwiPq: HAMMER Ggb GKwU GKK I ¯^Zš¿ K¨v‡Ûjw÷K hv WvDb †UªÛ gv‡K©‡U wifvm©v‡ji m¤¢vebv evwo‡q †Zv‡j| †Pbvi Dcvq: (1) HAMMER K¨v‡Ûjw÷‡Ki †QvU wi‡qj ewW _vK‡e Ges Gi †jvqvi k¨v‡Wv n‡e wi‡qj ewWi wظY ev Zvi †P‡qI †ewk j¤^v| HAMMER Gi Avcvi k¨v‡Wv Kvh©Z LyeB †QvU n‡e ev †Kv‡bv k¨v‡Wv bvI _vK‡Z cv‡i| HAMMER K¨v‡Ûjw÷KwU eywjk A_ev †eqvwik †h †Kv‡bv cÖKvi n‡Z cv‡i| wecixZ c¨vUvb©: HANGING MAN. 13 HAMMER ১৫
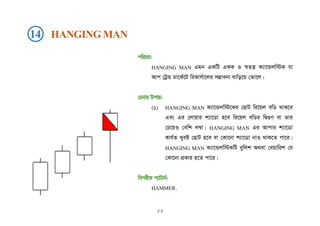
- 16. cwiPq: HANGING MAN Ggb GKwU GKK I ¯^Zš¿ K¨v‡Ûjw÷K hv Avc †UªÛ gv‡K©‡U wifvm©v‡ji m¤¢vebv evwo‡q †Zv‡j| †Pbvi Dcvq: (1) HANGING MAN K¨v‡Ûjw÷‡Ki †QvU wi‡qj ewW _vK‡e Ges Gi †jvqvi k¨v‡Wv n‡e wi‡qj ewWi wظY ev Zvi †P‡qI †ewk j¤^v| HANGING MAN Gi Avcvi k¨v‡Wv Kvh©Z LyeB †QvU n‡e ev †Kv‡bv k¨v‡Wv bvI _vK‡Z cv‡i| HANGING MAN K¨v‡Ûjw÷KwU eywjk A_ev †eqvwik †h †Kv‡bv cÖKvi n‡Z cv‡i| wecixZ c¨vUvb©: HAMMER. 14 HANGING MAN ১৬
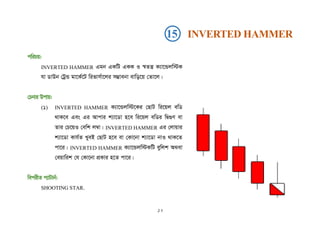
- 17. cwiPq: INVERTED HAMMER Ggb GKwU GKK I ¯^Zš¿ K¨v‡Ûjw÷K hv WvDb †UªÛ gv‡K©‡U wifvm©v‡ji m¤¢vebv evwo‡q †Zv‡j| †Pbvi Dcvq: (1) INVERTED HAMMER K¨v‡Ûjw÷‡Ki †QvU wi‡qj ewW _vK‡e Ges Gi Avcvi k¨v‡Wv n‡e wi‡qj ewWi wظY ev Zvi †P‡qI †ewk j¤^v| INVERTED HAMMER Gi †jvqvi k¨v‡Wv Kvh©Z LyeB †QvU n‡e ev †Kv‡bv k¨v‡Wv bvI _vK‡Z cv‡i| INVERTED HAMMER K¨v‡Ûjw÷KwU eywjk A_ev †eqvwik †h †Kv‡bv cÖKvi n‡Z cv‡i| wecixZ c¨vUvb©: SHOOTING STAR. 15 INVERTED HAMMER ১৭
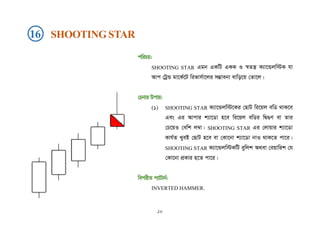
- 18. cwiPq: SHOOTING STAR Ggb GKwU GKK I ¯^Zš¿ K¨v‡Ûjw÷K hv Avc †UªÛ gv‡K©‡U wifvm©v‡ji m¤¢vebv evwo‡q †Zv‡j| †Pbvi Dcvq: (1) SHOOTING STAR K¨v‡Ûjw÷‡Ki †QvU wi‡qj ewW _vK‡e Ges Gi Avcvi k¨v‡Wv n‡e wi‡qj ewWi wظY ev Zvi †P‡qI †ewk j¤^v| SHOOTING STAR Gi †jvqvi k¨v‡Wv Kvh©Z LyeB †QvU n‡e ev †Kv‡bv k¨v‡Wv bvI _vK‡Z cv‡i| SHOOTING STAR K¨v‡Ûjw÷KwU eywjk A_ev †eqvwik †h †Kv‡bv cÖKvi n‡Z cv‡i| wecixZ c¨vUvb©: INVERTED HAMMER. 16 SHOOTING STAR ১৮
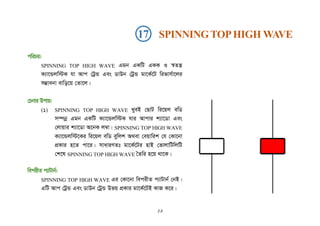
- 19. cwiPq: SPINNING TOP HIGH WAVE Ggb GKwU GKK I ¯^Zš¿ K¨v‡Ûjw÷K hv Avc †UªÛ Ges WvDb †UªÛ gv‡K©‡U wifvm©v‡ji m¤¢vebv evwo‡q †Zv‡j| †Pbvi Dcvq: (1) SPINNING TOP HIGH WAVE LyeB †QvU wi‡qj ewW m¤úbœ Ggb GKwU K¨v‡Ûjw÷K hvi Avcvi k¨v‡Wv Ges †jvqvi k¨v‡Wv A‡bK j¤^v| SPINNING TOP HIGH WAVE K¨v‡Ûjw÷‡Ki wi‡qj ewW eywjk A_ev †eqvwik †h †Kv‡bv cÖKvi n‡Z cv‡i| mvaviYZt gv‡K©‡Ui nvB †fvjvwUwjwU †k‡l SPINNING TOP HIGH WAVE ˆZwi n‡q _v‡K| wecixZ c¨vUvb©: SPINNING TOP HIGH WAVE Gi †Kv‡bv wecixZ c¨vUvb© †bB| GwU Avc †UªÛ Ges WvDb †UªÛ Dfq cÖKvi gv‡K©‡UB KvR K‡i| 17 SPINNINGTOPHIGH WAVE ১৯
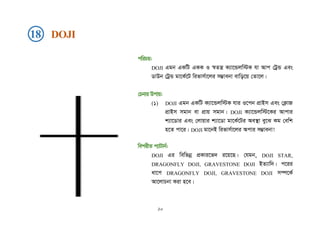
- 20. cwiPq: DOJI Ggb GKwU GKK I ¯^Zš¿ K¨v‡Ûjw÷K hv Avc †UªÛ Ges WvDb †UªÛ gv‡K©‡U wifvm©v‡ji m¤¢vebv evwo‡q †Zv‡j| †Pbvi Dcvq: (1) DOJI Ggb GKwU K¨v‡Ûjw÷K hvi I‡cb cÖvBm Ges †K¬vR cÖvBm mgvb ev cÖvq mgvb| DOJI K¨v‡Ûjw÷‡Ki Avcvi k¨v‡Wvi Ges †jvqvi k¨v‡Wv gv‡K©‡Ui Ae¯’v ey‡S Kg †ewk n‡Z cv‡i| DOJI gv‡bB wifvm©v‡ji Acvi m¤¢vebv! wecixZ c¨vUvb©: DOJI Gi wewfbœ cÖKvi‡f` i‡q‡Q| †hgb, DOJI STAR, DRAGONFLY DOJI, GRAVESTONE DOJI BZ¨vw`| c‡ii av‡c DRAGONFLY DOJI, GRAVESTONE DOJI m¤ú‡K© Av‡jvPbv Kiv n‡e| 18 DOJI ২০
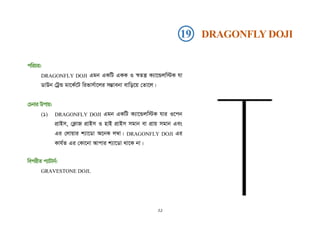
- 21. cwiPq: DRAGONFLY DOJI Ggb GKwU GKK I ¯^Zš¿ K¨v‡Ûjw÷K hv WvDb †UªÛ gv‡K©‡U wifvm©v‡ji m¤¢vebv evwo‡q †Zv‡j| †Pbvi Dcvq: (1) DRAGONFLY DOJI Ggb GKwU K¨v‡Ûjw÷K hvi I‡cb cÖvBm, †K¬vR cÖvBm I nvB cÖvBm mgvb ev cÖvq mgvb Ges Gi †jvqvi k¨v‡Wv A‡bK j¤^v| DRAGONFLY DOJI Gi Kvh©Z Gi †Kv‡bv Avcvi k¨v‡Wv _v‡K bv| wecixZ c¨vUvb©: GRAVESTONE DOJI. 19 DRAGONFLY DOJI ২১
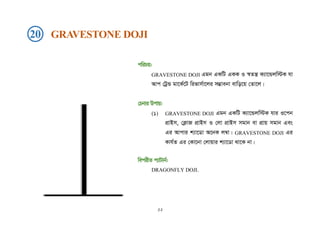
- 22. cwiPq: GRAVESTONE DOJI Ggb GKwU GKK I ¯^Zš¿ K¨v‡Ûjw÷K hv Avc †UªÛ gv‡K©‡U wifvm©v‡ji m¤¢vebv evwo‡q †Zv‡j| †Pbvi Dcvq: (1) GRAVESTONE DOJI Ggb GKwU K¨v‡Ûjw÷K hvi I‡cb cÖvBm, †K¬vR cÖvBm I †jv cÖvBm mgvb ev cÖvq mgvb Ges Gi Avcvi k¨v‡Wv A‡bK j¤^v| GRAVESTONE DOJI Gi Kvh©Z Gi †Kv‡bv †jvqvi k¨v‡Wv _v‡K bv| wecixZ c¨vUvb©: DRAGONFLY DOJI. 20 GRAVESTONE DOJI ২২
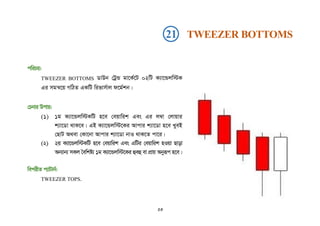
- 23. 21 TWEEZER BOTTOMS cwiPq: TWEEZER BOTTOMS WvDb †UªÛ gv‡K©‡U 02wU K¨v‡Ûjw÷K Gi mgš^‡q MwVZ GKwU wifvm©vj d‡g©kb| †Pbvi Dcvq: (1) 1g K¨v‡Ûjw÷KwU n‡e †eqvwik Ges Gi j¤^v †jvqvi k¨v‡Wv _vK‡e| GB K¨v‡Ûjw÷‡Ki Avcvi k¨v‡Wv n‡e LyeB †QvU A_ev †Kv‡bv Avcvi k¨v‡Wv bvI _vK‡Z cv‡i| (2) 2q K¨v‡Ûjw÷KwU n‡e †eqvwik Ges GwUi †eqvwik nIqv Qvov Ab¨vb¨ mKj ˆewkó¨ 1g K¨v‡Ûjw÷‡Ki ûeû ev cÖvq Abyiƒc n‡e| wecixZ c¨vUvb©: TWEEZER TOPS. 23
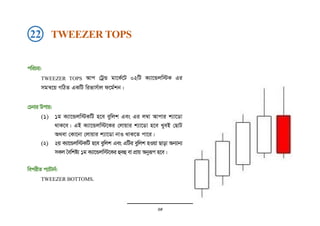
- 24. 22 TWEEZER TOPS cwiPq: TWEEZER TOPS Avc †UªÛ gv‡K©‡U 02wU K¨v‡Ûjw÷K Gi mgš^‡q MwVZ GKwU wifvm©vj d‡g©kb| †Pbvi Dcvq: (1) 1g K¨v‡Ûjw÷KwU n‡e eywjk Ges Gi j¤^v Avcvi k¨v‡Wv _vK‡e| GB K¨v‡Ûjw÷‡Ki †jvqvi k¨v‡Wv n‡e LyeB †QvU A_ev †Kv‡bv †jvqvi k¨v‡Wv bvI _vK‡Z cv‡i| (2) 2q K¨v‡Ûjw÷KwU n‡e eywjk Ges GwUi eywjk nIqv Qvov Ab¨vb¨ mKj ˆewkó¨ 1g K¨v‡Ûjw÷‡Ki ûeû ev cÖvq Abyiƒc n‡e| wecixZ c¨vUvb©: TWEEZER BOTTOMS. 24