Group5 professor proposes analysis

This document describes a professor's proposal to analyze factors that influence diamond prices. It involves: 1) Coding diamond characteristic variables like carat, color, clarity on numeric scales. 2) Grouping variable values through frequency analysis to make distributions more homogeneous. 3) Analyzing scatter plots between each characteristic and price to identify clusters. All but clarity showed clusters. 4) Performing cluster analysis to identify 5 optimal clusters. Regression models were developed for each cluster to predict price based on characteristics. 5) Using the regression models to predict prices for 3 sample diamonds purchased from different wholesalers, finding the quoted prices were higher than predicted in each case.

Group5 professor proposes analysis
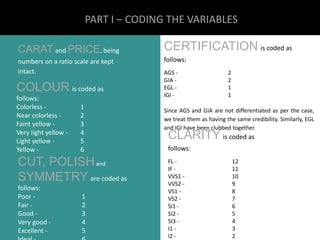
- 2. PART I – CODING THE VARIABLES CARAT andPRICE, being numbers on a ratio scale are kept intact. COLOUR is coded as follows: Colorless - 1 Near colorless - 2 Faint yellow - 3 Very light yellow - 4 Light yellow - 5 Yellow - 6 CUT, POLISHand SYMMETRY are coded as follows: Poor - 1 Fair - 2 Good - 3 Very good - 4 Excellent - 5 Ideal - 6 CERTIFICATION is coded as follows: AGS - 2 GIA - 2 EGL - 1 IGI - 1 Since AGS and GIA are not differentiated as per the case, we treat them as having the same credibility. Similarly, EGL and IGI have been clubbed together. CLARITY is coded as follows: FL - 12 IF - 11 VVS1 - 10 VVS2 - 9 VS1 - 8 VS2 - 7 SI1 - 6 SI2 - 5 SI3 - 4 I1 - 3 I2 - 2
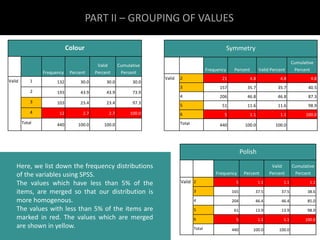
- 3. PART II – GROUPING OF VALUES Colour Frequency Percent Valid Percent Cumulative Percent Valid 1 132 30.0 30.0 30.0 2 193 43.9 43.9 73.9 3 103 23.4 23.4 97.3 4 12 2.7 2.7 100.0 Total 440 100.0 100.0 Symmetry Frequency Percent Valid Percent Polish Frequency Percent Valid Percent Cumulative Percent Valid 2 5 1.1 1.1 1.1 3 165 37.5 37.5 38.6 4 204 46.4 46.4 85.0 5 61 13.9 13.9 98.9 6 5 1.1 1.1 100.0 Total 440 100.0 100.0 Cumulative Percent Valid 2 21 4.8 4.8 4.8 3 157 35.7 35.7 40.5 4 206 46.8 46.8 87.3 5 51 11.6 11.6 98.9 6 5 1.1 1.1 100.0 Total 440 100.0 100.0 Here, we list down the frequency distributions of the variables using SPSS. The values which have less than 5% of the items, are merged so that our distribution is more homogenous. The values with less than 5% of the items are marked in red. The values which are merged are shown in yellow.
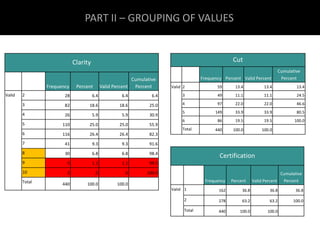
- 4. PART II – GROUPING OF VALUES Clarity Frequency Percent Valid Percent Cumulative Percent Valid 2 28 6.4 6.4 6.4 3 82 18.6 18.6 25.0 4 26 5.9 5.9 30.9 5 110 25.0 25.0 55.9 6 116 26.4 26.4 82.3 7 41 9.3 9.3 91.6 8 30 6.8 6.8 98.4 9 5 1.1 1.1 99.5 10 2 .5 .5 100.0 Total 440 100.0 100.0 Cut Frequency Percent Valid Percent Cumulative Percent Valid 2 59 13.4 13.4 13.4 3 49 11.1 11.1 24.5 4 97 22.0 22.0 46.6 5 149 33.9 33.9 80.5 6 86 19.5 19.5 100.0 Total 440 100.0 100.0 Certification Frequency Percent Valid Percent Cumulative Percent Valid 1 162 36.8 36.8 36.8 2 278 63.2 63.2 100.0 Total 440 100.0 100.0
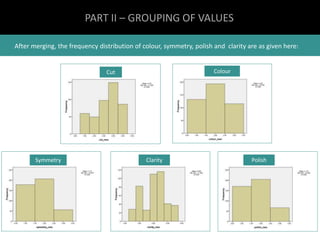
- 5. PART II – GROUPING OF VALUES After merging, the frequency distribution of colour, symmetry, polish and clarity are as given here: Cut Colour Symmetry Clarity Polish
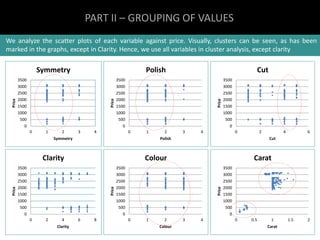
- 6. PART II – GROUPING OF VALUES We analyze the scatter plots of each variable against price. Visually, clusters can be seen, as has been marked in the graphs, except in Clarity. Hence, we use all variables in cluster analysis, except clarity 3500 3000 2500 2000 1500 1000 500 0 Symmetry 0 1 2 3 4 Price Symmetry 3500 3000 2500 2000 1500 1000 500 0 Polish 0 1 2 3 4 Price Polish 3500 3000 2500 2000 1500 1000 500 0 Clarity 0 2 4 6 8 Price Clarity 3500 3000 2500 2000 1500 1000 500 0 Colour 0 1 2 3 4 Price Colour 3500 3000 2500 2000 1500 1000 500 3500 3000 2500 2000 1500 1000 500 0 Carat 0 0.5 1 1.5 2 Price Carat 0 0 2 4 6 Price Cut Cut
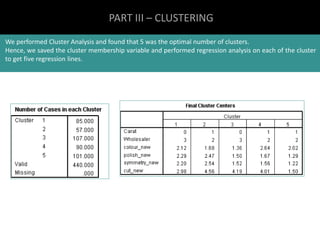
- 7. PART III – CLUSTERING We performed Cluster Analysis and found that 5 was the optimal number of clusters. Hence, we saved the cluster membership variable and performed regression analysis on each of the cluster to get five regression lines.
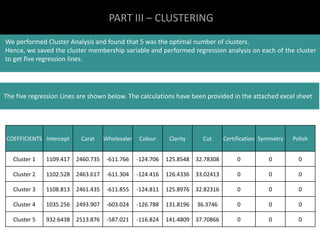
- 8. PART III – CLUSTERING We performed Cluster Analysis and found that 5 was the optimal number of clusters. Hence, we saved the cluster membership variable and performed regression analysis on each of the cluster to get five regression lines. The five regression Lines are shown below. The calculations have been provided in the attached excel sheet COEFFICIENTS Intercept Carat Wholesaler Colour Clarity Cut Certification Symmetry Polish Cluster 1 1109.417 2460.735 -611.766 -124.706 125.8548 32.78308 0 0 0 Cluster 2 1102.528 2463.617 -611.304 -124.416 126.4336 33.02413 0 0 0 Cluster 3 1108.813 2461.435 -611.855 -124.811 125.8976 32.82316 0 0 0 Cluster 4 1035.256 2493.907 -603.024 -126.788 131.8196 36.3746 0 0 0 Cluster 5 932.6438 2513.876 -587.021 -116.824 141.4809 37.70866 0 0 0
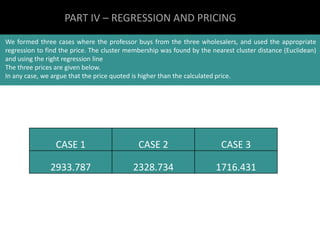
- 9. PART IV – REGRESSION AND PRICING We formed three cases where the professor buys from the three wholesalers, and used the appropriate regression to find the price. The cluster membership was found by the nearest cluster distance (Euclidean) and using the right regression line The three prices are given below. In any case, we argue that the price quoted is higher than the calculated price. CASE 1 CASE 2 CASE 3 2933.787 2328.734 1716.431