
4 f ballegeer - seize the real world
- 1. Seize the real World Filip Ballegeer, 20th April 2010
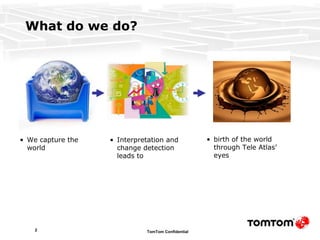
- 2. What do we do? We capture the world Interpretation and change detection leads to birth of the world through Tele Atlas’ eyes
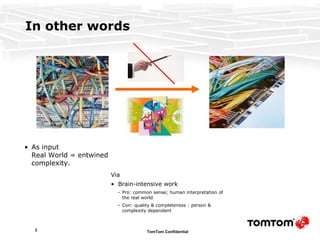
- 3. In other words As input Real World = entwined complexity. Via Brain-intensive work Pro: common sense; human interpretation of the real world Con: quality & completeness : person & complexity dependent
- 4. Target of CPU Technology Build processes to Create and maintain navigable maps by means of processes, sources and tools to support cost efficient map production to produce products & services in line with the market quality and specification requirements Sources (50 000 +) Paper maps, tourist maps, construction plans Private & Government Source Partners National Post Send surveyors in the field to check reality Terrestrial imagery Satellite Images Aerial Images Mobile Mapping data
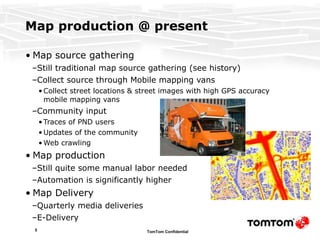
- 5. Map production @ present Map source gathering Still traditional map source gathering (see history) Collect source through Mobile mapping vans Collect street locations & street images with high GPS accuracy mobile mapping vans Community input Traces of PND users Updates of the community Web crawling Map production Still quite some manual labor needed Automation is significantly higher Map Delivery Quarterly media deliveries E-Delivery
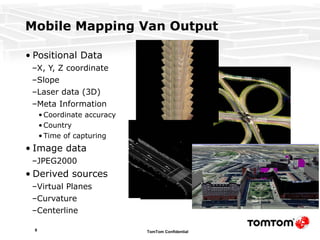
- 6. Mobile Mapping Van Output Positional Data X, Y, Z coordinate Slope Laser data (3D) Meta Information Coordinate accuracy Country Time of capturing Image data JPEG2000 Derived sources Virtual Planes Curvature Centerline
- 7. Evolutions in map production Map source Community, Community, Community GPS traces Web crawling Community map editor & map corrections Links to social networks Dynamic map features Etc.. Map delivery E-Delivery Full maps or transaction stream Services
- 8. Future: Better, Faster, More Better: Quality, according to expectation of customer Faster: Automate, Automate, Automate Apply Machine learning aspects => Quality gate Image recognition No Touch processes Hook into existing communities More Dynamic map features Pedestrian ADAS Innovation Internal process Innovative products
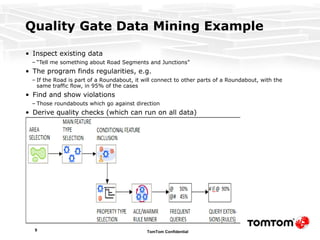
- 9. Quality Gate Data Mining Example Inspect existing data “ Tell me something about Road Segments and Junctions” The program finds regularities, e.g. If the Road is part of a Roundabout, it will connect to other parts of a Roundabout, with the same traffic flow, in 95% of the cases Find and show violations Those roundabouts which go against direction Derive quality checks (which can run on all data)
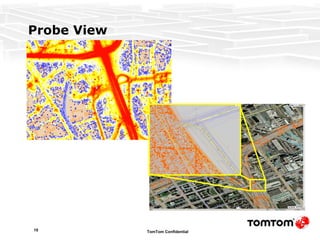
- 10. Probe View
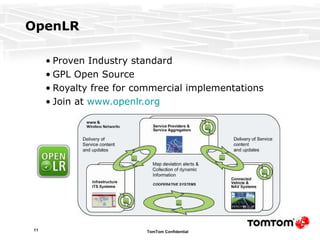
- 11. OpenLR Proven Industry standard GPL Open Source Royalty free for commercial implementations Join at www.openlr.org
- 12. Results of Map production evolution HD Traffic Live traffic Jam information GSM user locations PND user locations High accuracy IQ Routes/Speed profiles Average Speed per road within a given timeframe ADAS Slope information Acceleration profiles Curvature Etc…
- 13. Area’s of interest & current developments Feature extraction through image recognition Probe feature extraction Statistical machine learning applications Automatic map conflation tools 3D objects extraction & manipulation 3D city maps Derive Junction views Hookup to social networks Innovation (Experimentation Time) Innovation Centre portal: http://www.innovation-geo-lbs.com / … .
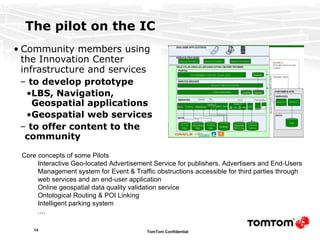
- 14. The pilot on the IC Community members using the Innovation Center infrastructure and services to develop prototype LBS, Navigation, Geospatial applications Geospatial web services to offer content to the community Core concepts of some Pilots Interactive Geo-located Advertisement Service for publishers, Advertisers and End-Users Management system for Event & Traffic obstructions accessible for third parties through web services and an end-user application Online geospatial data quality validation service Ontological Routing & POI Linking Intelligent parking system ....
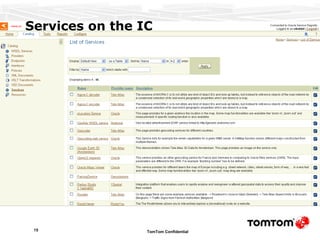
- 15. Services on the IC
Editor's Notes
- #11: Answers 0: It is a map of all the TT probe points gathered for a particular area with a Tele Atlas map underneath 1: The Tele Atlas Ghent Office area 2: It indicates the nr of community probe points (density) gathered for that spot by the TT devices. (blue: 1 tag, white, 2 or more …. Red : a lot of tags) 3: That’s the location of the TA Ghent office where all employees are using a TT devices ;o) 4: It maybe a boat 5: Just a person activating his TT over there for a short period, it could also be a disrupted signal resulting in scattered points 6: Because people are slowing down there for the roundabout, as such the devices will create more probe points at that spot 7: It also indicates the accuracy of the probe points 8: There is a traffic light there, so people stop a lot at that location 9: The probe points are also attributed with height information, so we can derive Z-level info from them 10: A TT device continues to route in a tunnel with the help of gyro’s & speed estimation so it can also continue create probe points 11: We can determine speed out of probe this combined with travel behavior, used road types and other meta data (if needed), we can figure out a range of vehicle types and enrich our maps 12: The probe points are attributed to which sequence they belong (a probe trace), they also contain an accuracy indication. The probe traces with acceptable accurate probe points are filtered out, then the average trace is calculated out of the resulting bundle of probe traces enabling us to form a nice network.