14 feb mis
Download as xlsx, pdf0 likes184 views

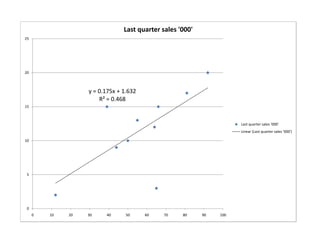
The document shows sales data from 10 stores over the last quarter, including sales amounts, number of stores visited, and population of the sales area. A linear regression line has an R2 value of 0.468, indicating a moderate positive correlation between last quarter sales and population of the sales area.
1 of 3
Download to read offline
Ad
Recommended
Caca
Cacaalejaandro
Ěý
The document is a graph showing a single data series over 20 units on the x-axis. The y-axis ranges from 0 to 40 million and shows an initial high value tapering down to around 5 million by the final x-unit. Overall the graph depicts a single data series declining steadily over the range on the x-axis.S out 13_1555-location_plan_scale_1_2500-410719
S out 13_1555-location_plan_scale_1_2500-410719Donald Jones
Ěý
This location plan shows an area around East Swindon, including Thornhill Road, the A420, and Vine Lane. The plan is provided for information purposes only and should not be used for construction. All dimensions must be verified on site. Copyright of the map information is held by Ordnance Survey.Ms communication design work
Ms communication design workYoo-kyung Han
Ěý
The document shows monthly donation amounts from 2009-2015 for a charity. Donations came from checks, online donations, and website traffic. Check donations were highest from 55,000 to 75,000 per month while online donations increased over time, reaching 15,000 per month by 2015. Traffic to the charity website remained steady around 5,000 visitors per month.School work
School workYoo-kyung Han
Ěý
The document shows monthly donation amounts from 2009-2015 for a charity. Donations came from checks, online donations, and website traffic. Check donations were highest from 55,000 to 75,000 per month while online donations increased over time, reaching 15,000 per month by 2015. Traffic to the charity website remained steady around 5,000 visitors per month.Arreyadi - Ratecard 2013
Arreyadi - Ratecard 2013imsholding
Ěý
This document contains the rate card and technical specifications for advertising in the Arreyadi newspaper in Saudi Arabia for 2013. It lists the prices for various ad sizes and placements in both full color and black and white. It provides the rates for full pages, half pages, quarter pages, and special placements like front page, inside covers, and double page spreads. It also includes specifications for file formats, resolutions, and technical requirements. The final section outlines terms, conditions, pricing and contact information for special operations and loose inserts.Q1 2016 The Woodlands Office Snapshot
Q1 2016 The Woodlands Office SnapshotColliers International | Houston
Ěý
The Woodlands office market report summarizes Q1 2016 data. Vacancy rates decreased across most classes compared to Q4 2015, with the exception of class C. Net absorption remained positive while class A rental rates increased. The greater Houston area economy is impacted by oil prices, but The Woodlands office market is performing better than expected given low oil prices around $40 per barrel. Recent transportation projects may boost the submarket.Cf Template
Cf Templatejamescheong
Ěý
The document summarizes an individual's cash flow for the year ended 30 June 2003, showing a total inflow of $78,000 after taxes and contributions, outflows of $45,000 for household and other expenses, and a net cash flow of $33,000. It also lists the individual's assets and liabilities as of 1 July 2003, totaling over $1.2 million in assets and $78,000 in liabilities, for a net worth of approximately $1.15 million.IP Targeted Search
IP Targeted SearchSiteVisibility
Ěý
The document presents a set of data points related to CPA sales, with numerical values indicating performance metrics. Key figures include sales and CPA values of varying amounts. Overall, it seems to summarize sales performance in a structured manner.Practica para evaluacion de pares
Practica para evaluacion de paresValentinRamirezCabal
Ěý
The document is the balance sheet and income statement for Elite S.A. de C.V. for the years ending December 31, 2020 and 2019. It shows that total assets increased 51.48% from 2019 to 2020 due to rises in current assets like cash, accounts receivable, and inventory. Net income remained the same at $69,000 from 2019 to 2020 despite a 0.69% increase in net sales. Financial ratios show liquidity declined while profitability margins were relatively stable.Seat nv
Seat nvfevzidinc
Ěý
This document provides an overview of a company including its production, balance sheet, workforce, net sales, and reasons to invest. It shows that the company's workforce grew from 2006 to 2011, net sales increased each year from 2007 to 2011, and it plans a new product model each quarter in 2012 after investing over 2.6 billion euro since the crisis. The document recommends investing because of the company's improved operating results, increased employment, sales leadership, and product offensive.M60 Towns: Paul Smith, Housing the Powerhouse
M60 Towns: Paul Smith, Housing the PowerhousePlace North West
Ěý
The document outlines the development conference for M60 towns and presents various scenarios for Tameside's growth under the Greater Manchester Spatial Framework (GMSF). It details potential outcomes in terms of industrial and warehousing space, office areas, new homes, operational jobs, gross value added, and council tax revenues. The ambitious GMSF scenario projects significant increases in economic contributions and job creation compared to scenarios without the GMSF.Temp 1
Temp 1Kashif Amin
Ěý
The cash budget for Woody Toy Repair Shop projects increasing sales from $18,000 in April to $36,000 in June, with total quarterly sales of $81,000. Fixed costs like rent and truck payments will remain steady at $7,750 and $2,000 per month respectively. Variable costs include wages for Rosy of $6,000 per month plus a $6,000 bonus in May, and other expenses like telephone and vehicles. The net cash flow is projected to be negative $2,300 in April but increase to a positive $11,900 by June as sales rise and cover growing costs.10-BT-HocMon House
10-BT-HocMon HouseTrieu Vo
Ěý
1. The document contains architectural plans for a multi-level residential building including floor plans and sections with dimensions, notes and details.
2. The plans include 6 levels above ground (levels 1-5 and roof) and 1 level below ground (level 0) with various rooms and structures labeled.
3. Dimensions, materials, and technical notes are provided throughout the plans regarding construction and building features.Operating costing sums
Operating costing sumsviharr
Ěý
This document provides the monthly operating costs for two trucks owned by a transport company, including expenses like driver salaries, cleaning wages, fuel, oil, rent, taxes, depreciation, repairs, supervision, and overhead. Truck No. 1 costs 3,440 per month to operate while Truck No. 2 costs 3,680 per month due to higher fuel costs and driver salary but equal garage rent, taxes, and overhead expenses.Chart Program Affiliat
Chart Program Affiliatmrjoe88
Ěý
This document outlines an affiliate marketing program with 4 levels. Level 1 earns a 15% commission on their own sales and the sales of those they recruit in their first level. They would earn $208 for the month. Lower levels earn smaller commissions on an increasing number of recruits, with level 4 potentially earning $14,400 per month from sales across 81 recruits. The program emphasizes continuous and exponential growth in income from new recruits over time.C1 Designated Sites - Yr2 Location plan Southbound 1 AS BUILTS-A3 LAND SB Com...
C1 Designated Sites - Yr2 Location plan Southbound 1 AS BUILTS-A3 LAND SB Com...Phil Clarke
Ěý
This document is a landscaping plan for the M18 motorway between junctions 2 and 1 near Wadworth, approved by P. Clarke on March 25, 2013. It was designed by A-one+, contains the project name, scale, drawing number, and contact information for A-one+, and notes that it is not to be scaled from the drawing.Migration map final
Migration map finalMarjan DODAJ
Ěý
This document appears to be a migration map showing the estimated dates that various haplogroups of mitochondrial DNA migrated to different regions, with letters representing different haplogroups and numbers representing the estimated migration dates in thousands of years ago. It provides migration date estimates for 25 haplogroups ranging from over 100,000 to 10,000 years ago.Projek akhir a163333
Projek akhir a163333Imman Nerrysya
Ěý
The document contains a case study and calculations regarding traffic flow between 6 cities (A to F) in Malaysia. It provides data on household sizes, floor areas, daily traffic volumes between cities, and calculations of toll revenues for a proposed highway between the cities. Key details include:
- Daily traffic volumes and calculations of emissions and withdrawals for each city.
- Calculations of traffic volumes and emissions/withdrawals for private vehicle trips between cities.
- Adjusted calculations to make total emissions and withdrawals equal.
- A origin-destination matrix showing estimated daily traffic volumes between each city pair.
- Recalculated matrix and volumes for trips using the highway.
- Calculations of combinedMozambique Human Characteristics
Mozambique Human Characteristicscollin18
Ěý
Mozambique is a predominantly Christian country, with most people being either Roman Catholic or Protestant. People in inland areas live in houses while those on the coast often make a living from fishing. Farming is also very common, and farmer's markets are popular, as the average annual income is only around $900.Family life in turkey
Family life in turkeyHudaMohamed90
Ěý
Family life in Turkey is centered around marriage, with specific gender roles for mothers and fathers. Mothers typically care for the home and children, while fathers work to financially support the family. Housing is also an important aspect of family life in Turkey.A Comparison of Recent Trends of International Marriages and Divorces in Europe
A Comparison of Recent Trends of International Marriages and Divorces in EuropeGiampaolo Lanzieri
Ěý
This document presents research on trends in international marriages and divorces in Europe. It discusses various measures and indicators that can be used to analyze intermarriage rates as a proxy for migrants' integration. These include proportions of mixed marriages, intermarriage ratios for specific groups, and indexes that measure the degree of endogamy or exogamy on a scale from -1 to 1. Data shows most European countries have moderate to strong endogamy, though some indexes suggest indifference or weak exogamy. The document raises open questions about what characteristics and data sources are best to measure intermarriage as an integration indicator and which specific indicators should be used.The Effects of Divorce on Children
The Effects of Divorce on Childrennhnursing99
Ěý
Children may experience stress from changes in their family structure like divorce through fear of abandonment, loss of attachment with a parent, and hostility between parents. A child grieving the divorce may go through shock, denial, and anger as a natural process of restoring self-confidence. Older children between ages 9-12 may feel anger, loneliness, shock, surprise, and fear and potentially reject one parent. Maintaining knowledgeable, experienced, and involved parenting can help children cope practically with divorce. The longer and more conflictual the legal divorce proceedings, the worse the relationship between co-parents may be perceived by both parents.Divorce power point
Divorce power pointAmanderrzz
Ěý
This document discusses divorce and its effects. It notes that while 50% of marriages ending in divorce is a commonly cited statistic, it may not be accurate due to assumptions. Divorce can negatively impact children by making them feel sad, depressed or blame themselves, and sometimes consider suicide. The top causes of divorce reported are financial problems and lack of commitment. Statistics show that divorce rates decrease with subsequent marriages but are still high for second and third marriages.DIVORCE AS A SOCIALĚýPROBLEM
DIVORCE AS A SOCIALĚýPROBLEMMasoom Khushi
Ěý
Divorce is defined as the dissolution of marriage due to issues such as communication breakdown, financial conflicts, and various forms of abuse, including emotional mistreatment. Research indicates that divorce often leads to negative life outcomes, including lower life expectancies and poorer health recovery post-illness. While many perceive an increase in divorce rates attributed to lack of patience and cultural influences, it is acknowledged that children may fare better in stable, single-parent environments than in abusive intact families.Divorce Sociology
Divorce Sociologyjjloveday
Ěý
1) The divorce rate in the United States is the highest in the world, nearly twice as high as Canada and four times higher than Japan. 2) Factors that contribute to the high divorce rate include an emphasis on individualism over family, declining romantic love after the honeymoon phase ends, greater financial independence for women, stress from dual-career families, and easier legal access to divorce. 3) Those at greatest risk of divorce include young couples, couples with brief courtships, couples lacking financial stability, and couples where one or both partners have substance abuse problems.Divorce & Children
Divorce & ChildrenLucia Merino, LCSW Bilingual Psychological Services
Ěý
Divorce is the legal dissolution of a marriage. Around 40-50% of marriages in the US end in divorce, with common factors including poor communication, infidelity, abuse, and financial problems. Divorce affects children of all ages, potentially causing confusion, anger, depression, and behavioral issues. It is important to be honest with children, avoid blame, maintain routines, listen to their feelings, reassure their love is unchanged, and ensure they feel supported.Divorce Presentation[2]
Divorce Presentation[2]kelleysllvn
Ěý
Divorce is a legal process that dissolves a marriage and restores individuals to single status. No-fault divorce does not require proof of wrongdoing. Around 50% of first marriages, 67% of second, and 74% of third marriages end in divorce. Children of divorced parents are more likely to have problems in school, abuse substances, and divorce as adults. After divorce, 90% of mothers have custody while divorced men struggle with relationships and debt. Divorce rates vary globally with the US having the highest rate at 4.95 per 1000 people. Around 25% of mainline Protestants and Catholics have been divorced. Some argue polygamy provides stability and childcare support while others say it goes againstCauses and Effects of Divorce
Causes and Effects of Divorcesdemir79
Ěý
Divorce has become more common in modern society due to rapid social changes and pressure on young people to marry before they are ready. This can lead to unrealistic expectations and lack of preparation. Divorce has negative effects on children, women, and men. Children of divorced parents often face social and emotional problems. Divorced women struggle financially and with childcare. Men also encounter financial difficulties and problems maintaining relationships with their children after a divorce.Divorce power point
Divorce power pointhmfowler
Ěý
Divorce laws have evolved over centuries from only allowing divorce for causes like adultery to broader acceptance and regulation of divorce through state laws. Currently about half of first marriages in the US end in divorce. Divorce affects both parents and children, with common parental issues including emotional distress, unhealthy coping habits, and social isolation. Children of divorce often experience lower self-esteem, difficulty with relationships, feelings of responsibility for the divorce, and behavioral or academic problems. Effective co-parenting with open communication helps children adjust after a divorce.More Related Content
What's hot (11)
IP Targeted Search
IP Targeted SearchSiteVisibility
Ěý
The document presents a set of data points related to CPA sales, with numerical values indicating performance metrics. Key figures include sales and CPA values of varying amounts. Overall, it seems to summarize sales performance in a structured manner.Practica para evaluacion de pares
Practica para evaluacion de paresValentinRamirezCabal
Ěý
The document is the balance sheet and income statement for Elite S.A. de C.V. for the years ending December 31, 2020 and 2019. It shows that total assets increased 51.48% from 2019 to 2020 due to rises in current assets like cash, accounts receivable, and inventory. Net income remained the same at $69,000 from 2019 to 2020 despite a 0.69% increase in net sales. Financial ratios show liquidity declined while profitability margins were relatively stable.Seat nv
Seat nvfevzidinc
Ěý
This document provides an overview of a company including its production, balance sheet, workforce, net sales, and reasons to invest. It shows that the company's workforce grew from 2006 to 2011, net sales increased each year from 2007 to 2011, and it plans a new product model each quarter in 2012 after investing over 2.6 billion euro since the crisis. The document recommends investing because of the company's improved operating results, increased employment, sales leadership, and product offensive.M60 Towns: Paul Smith, Housing the Powerhouse
M60 Towns: Paul Smith, Housing the PowerhousePlace North West
Ěý
The document outlines the development conference for M60 towns and presents various scenarios for Tameside's growth under the Greater Manchester Spatial Framework (GMSF). It details potential outcomes in terms of industrial and warehousing space, office areas, new homes, operational jobs, gross value added, and council tax revenues. The ambitious GMSF scenario projects significant increases in economic contributions and job creation compared to scenarios without the GMSF.Temp 1
Temp 1Kashif Amin
Ěý
The cash budget for Woody Toy Repair Shop projects increasing sales from $18,000 in April to $36,000 in June, with total quarterly sales of $81,000. Fixed costs like rent and truck payments will remain steady at $7,750 and $2,000 per month respectively. Variable costs include wages for Rosy of $6,000 per month plus a $6,000 bonus in May, and other expenses like telephone and vehicles. The net cash flow is projected to be negative $2,300 in April but increase to a positive $11,900 by June as sales rise and cover growing costs.10-BT-HocMon House
10-BT-HocMon HouseTrieu Vo
Ěý
1. The document contains architectural plans for a multi-level residential building including floor plans and sections with dimensions, notes and details.
2. The plans include 6 levels above ground (levels 1-5 and roof) and 1 level below ground (level 0) with various rooms and structures labeled.
3. Dimensions, materials, and technical notes are provided throughout the plans regarding construction and building features.Operating costing sums
Operating costing sumsviharr
Ěý
This document provides the monthly operating costs for two trucks owned by a transport company, including expenses like driver salaries, cleaning wages, fuel, oil, rent, taxes, depreciation, repairs, supervision, and overhead. Truck No. 1 costs 3,440 per month to operate while Truck No. 2 costs 3,680 per month due to higher fuel costs and driver salary but equal garage rent, taxes, and overhead expenses.Chart Program Affiliat
Chart Program Affiliatmrjoe88
Ěý
This document outlines an affiliate marketing program with 4 levels. Level 1 earns a 15% commission on their own sales and the sales of those they recruit in their first level. They would earn $208 for the month. Lower levels earn smaller commissions on an increasing number of recruits, with level 4 potentially earning $14,400 per month from sales across 81 recruits. The program emphasizes continuous and exponential growth in income from new recruits over time.C1 Designated Sites - Yr2 Location plan Southbound 1 AS BUILTS-A3 LAND SB Com...
C1 Designated Sites - Yr2 Location plan Southbound 1 AS BUILTS-A3 LAND SB Com...Phil Clarke
Ěý
This document is a landscaping plan for the M18 motorway between junctions 2 and 1 near Wadworth, approved by P. Clarke on March 25, 2013. It was designed by A-one+, contains the project name, scale, drawing number, and contact information for A-one+, and notes that it is not to be scaled from the drawing.Migration map final
Migration map finalMarjan DODAJ
Ěý
This document appears to be a migration map showing the estimated dates that various haplogroups of mitochondrial DNA migrated to different regions, with letters representing different haplogroups and numbers representing the estimated migration dates in thousands of years ago. It provides migration date estimates for 25 haplogroups ranging from over 100,000 to 10,000 years ago.Projek akhir a163333
Projek akhir a163333Imman Nerrysya
Ěý
The document contains a case study and calculations regarding traffic flow between 6 cities (A to F) in Malaysia. It provides data on household sizes, floor areas, daily traffic volumes between cities, and calculations of toll revenues for a proposed highway between the cities. Key details include:
- Daily traffic volumes and calculations of emissions and withdrawals for each city.
- Calculations of traffic volumes and emissions/withdrawals for private vehicle trips between cities.
- Adjusted calculations to make total emissions and withdrawals equal.
- A origin-destination matrix showing estimated daily traffic volumes between each city pair.
- Recalculated matrix and volumes for trips using the highway.
- Calculations of combinedViewers also liked (11)
Mozambique Human Characteristics
Mozambique Human Characteristicscollin18
Ěý
Mozambique is a predominantly Christian country, with most people being either Roman Catholic or Protestant. People in inland areas live in houses while those on the coast often make a living from fishing. Farming is also very common, and farmer's markets are popular, as the average annual income is only around $900.Family life in turkey
Family life in turkeyHudaMohamed90
Ěý
Family life in Turkey is centered around marriage, with specific gender roles for mothers and fathers. Mothers typically care for the home and children, while fathers work to financially support the family. Housing is also an important aspect of family life in Turkey.A Comparison of Recent Trends of International Marriages and Divorces in Europe
A Comparison of Recent Trends of International Marriages and Divorces in EuropeGiampaolo Lanzieri
Ěý
This document presents research on trends in international marriages and divorces in Europe. It discusses various measures and indicators that can be used to analyze intermarriage rates as a proxy for migrants' integration. These include proportions of mixed marriages, intermarriage ratios for specific groups, and indexes that measure the degree of endogamy or exogamy on a scale from -1 to 1. Data shows most European countries have moderate to strong endogamy, though some indexes suggest indifference or weak exogamy. The document raises open questions about what characteristics and data sources are best to measure intermarriage as an integration indicator and which specific indicators should be used.The Effects of Divorce on Children
The Effects of Divorce on Childrennhnursing99
Ěý
Children may experience stress from changes in their family structure like divorce through fear of abandonment, loss of attachment with a parent, and hostility between parents. A child grieving the divorce may go through shock, denial, and anger as a natural process of restoring self-confidence. Older children between ages 9-12 may feel anger, loneliness, shock, surprise, and fear and potentially reject one parent. Maintaining knowledgeable, experienced, and involved parenting can help children cope practically with divorce. The longer and more conflictual the legal divorce proceedings, the worse the relationship between co-parents may be perceived by both parents.Divorce power point
Divorce power pointAmanderrzz
Ěý
This document discusses divorce and its effects. It notes that while 50% of marriages ending in divorce is a commonly cited statistic, it may not be accurate due to assumptions. Divorce can negatively impact children by making them feel sad, depressed or blame themselves, and sometimes consider suicide. The top causes of divorce reported are financial problems and lack of commitment. Statistics show that divorce rates decrease with subsequent marriages but are still high for second and third marriages.DIVORCE AS A SOCIALĚýPROBLEM
DIVORCE AS A SOCIALĚýPROBLEMMasoom Khushi
Ěý
Divorce is defined as the dissolution of marriage due to issues such as communication breakdown, financial conflicts, and various forms of abuse, including emotional mistreatment. Research indicates that divorce often leads to negative life outcomes, including lower life expectancies and poorer health recovery post-illness. While many perceive an increase in divorce rates attributed to lack of patience and cultural influences, it is acknowledged that children may fare better in stable, single-parent environments than in abusive intact families.Divorce Sociology
Divorce Sociologyjjloveday
Ěý
1) The divorce rate in the United States is the highest in the world, nearly twice as high as Canada and four times higher than Japan. 2) Factors that contribute to the high divorce rate include an emphasis on individualism over family, declining romantic love after the honeymoon phase ends, greater financial independence for women, stress from dual-career families, and easier legal access to divorce. 3) Those at greatest risk of divorce include young couples, couples with brief courtships, couples lacking financial stability, and couples where one or both partners have substance abuse problems.Divorce & Children
Divorce & ChildrenLucia Merino, LCSW Bilingual Psychological Services
Ěý
Divorce is the legal dissolution of a marriage. Around 40-50% of marriages in the US end in divorce, with common factors including poor communication, infidelity, abuse, and financial problems. Divorce affects children of all ages, potentially causing confusion, anger, depression, and behavioral issues. It is important to be honest with children, avoid blame, maintain routines, listen to their feelings, reassure their love is unchanged, and ensure they feel supported.Divorce Presentation[2]
Divorce Presentation[2]kelleysllvn
Ěý
Divorce is a legal process that dissolves a marriage and restores individuals to single status. No-fault divorce does not require proof of wrongdoing. Around 50% of first marriages, 67% of second, and 74% of third marriages end in divorce. Children of divorced parents are more likely to have problems in school, abuse substances, and divorce as adults. After divorce, 90% of mothers have custody while divorced men struggle with relationships and debt. Divorce rates vary globally with the US having the highest rate at 4.95 per 1000 people. Around 25% of mainline Protestants and Catholics have been divorced. Some argue polygamy provides stability and childcare support while others say it goes againstCauses and Effects of Divorce
Causes and Effects of Divorcesdemir79
Ěý
Divorce has become more common in modern society due to rapid social changes and pressure on young people to marry before they are ready. This can lead to unrealistic expectations and lack of preparation. Divorce has negative effects on children, women, and men. Children of divorced parents often face social and emotional problems. Divorced women struggle financially and with childcare. Men also encounter financial difficulties and problems maintaining relationships with their children after a divorce.Divorce power point
Divorce power pointhmfowler
Ěý
Divorce laws have evolved over centuries from only allowing divorce for causes like adultery to broader acceptance and regulation of divorce through state laws. Currently about half of first marriages in the US end in divorce. Divorce affects both parents and children, with common parental issues including emotional distress, unhealthy coping habits, and social isolation. Children of divorce often experience lower self-esteem, difficulty with relationships, feelings of responsibility for the divorce, and behavioral or academic problems. Effective co-parenting with open communication helps children adjust after a divorce.Ad
Similar to 14 feb mis (20)
Examen parcial
Examen parcialassalin
Ěý
1. The document contains tables showing quantity, price, and value over 6 periods for item A. The total value decreases each period from S/.195,000 to S/.129,377.54.
2. A graph shows total sales for item A over 12 years, decreasing from S/.195,000 in year 1 to S/.123,426.17 in year 7.
3. Another graph shows a linear relationship between quantity and price for item A, with a correlation coefficient of 0.939, indicating a strong positive linear relationship.Attention flow by tagging prediction
Attention flow by tagging predictionYONG ZHENG
Ěý
The document discusses the analysis of time-series data related to the usage of tags, specifically focusing on the tag 'bush' from 2004 to 2010. It details the data preparation, model fitting, and selection processes, leading to the conclusion that an ARIMA (1,1,1) model is effective for forecasting usage trends. Future research directions include using similar analysis for other political figures and topics to detect trends and seasonal effects.January 2010 Market Stats Atlantic County, NJ
January 2010 Market Stats Atlantic County, NJMatthew Haviland
Ěý
The document provides market data and trends for residential real estate in Atlantic County, New Jersey from 2001 to 2009. It includes the following key points:
- New listings have declined since peaking in 2008 while sold listings have remained relatively stable, resulting in higher inventory levels.
- The median sale price peaked at $279,418 in 2007 but has since declined to $223,040 in 2009.
- The number of units sold has also declined from a high of 2,607 in 2005 to 1,251 in 2009.
- As of January 2010, the months of supply was estimated to be 16.82 months for residential properties and 20.63 months for condominiums based on current inventoryAbsorptionratesapril
AbsorptionratesaprilDawnMillerHomes.com at Exit Realty Central
Ěý
The document provides data on housing inventory and absorption rates across several cities and price ranges in Virginia. It shows the number of active listings and homes sold over the past 6 months, calculates the monthly absorption rate, and estimates the number of months it would take to sell the current inventory at that rate. For most areas and lower price points, absorption would take between 7-12 months, while higher prices and certain cities would take over a year to fully absorb the inventory.2008 O Level Analysis
2008 O Level Analysismoe_maldives
Ěý
1) Educational statistics from the Maldives for the years 2005-2009 are presented, including enrollment rates, performance on standardized exams, and subjects studied.
2) Enrollment in secondary education increased between 2005-2008 for males, atolls, and nationally. Exam pass rates were highest in 2009 compared to previous years.
3) The number of students studying certain subjects like Islam, Dhivehi, math, and English increased from 2007 to 2008. Most students aimed to earn their School Leaving Certificate with 1-5 subjects rather than more.CMC Analyst 20Presentation 20-%20Q3%20(FY%2005)
CMC Analyst 20Presentation 20-%20Q3%20(FY%2005)finance21
Ěý
The document provides financial results for an IT company for the 9 months ended December 2004 and the quarter ended December 2005.
For the 9 months ended December 2004, total revenue was Rs. 570 crore, profit before tax was Rs. 48 crore, and profit after tax was Rs. 45 crore. International revenue grew 55% and the international business share increased to 25% of overall revenue.
For the quarter ended December 2005, total revenue was Rs. 205.2 crore, profit before tax was Rs. 10.5 crore, and profit after tax was Rs. 9.3 crore. Embedded systems revenue grew 132% year-over-year and contributed 21% of international revenues.Da exercise 7 sep 09 (2)
Da exercise 7 sep 09 (2)Rajendra Inani
Ěý
The document contains data on the stages of domination in a game with percentages of tickets and other values. It then shows calculations for revenue earned from the game using different prices and subsidies. The totals suggest that with a 4 token price and subsidies, around 593,000 trips could be made generating total revenue of around 2.96 million. A survey of 5% of the population may help refine some of the estimated values.Deutsche EuroShop | Company Presentation | 05/10
Deutsche EuroShop | Company Presentation | 05/10Deutsche EuroShop AG
Ěý
Deutsche EuroShop is Germany's only public company that invests solely in shopping centers. It owns 17 shopping centers located primarily in Germany but also in Poland, Austria, and Hungary. The company focuses on acquiring and developing shopping centers, maintaining a stable dividend, and increasing its net asset value over the long term. Its shopping centers are anchored by well-known retailers and have high occupancy rates.Section 6 practice b
Section 6 practice bjslloyd23
Ěý
1. The document provides examples and practice problems involving functions. It includes:
2. Questions about identifying input and output variables in functions presented in tables. It also asks to determine if pairings are functions.
3. Practice writing rules for functions given tables of ordered pairs and identifying domains and ranges.
4. Word problems involving writing rules for functions based on real world scenarios and identifying independent and dependent variables.Hampton Roads Real Estate Absorption Rates
Hampton Roads Real Estate Absorption RatesDawnMillerHomes.com at Exit Realty Central
Ěý
The document contains data on housing inventory and absorption rates across several cities in Virginia. It shows the number of months it would take to sell the current inventory at the current monthly sales rate for different price ranges in each city from March 2010. For most price ranges, absorption rates were highest between 7-15 months, but increased to over 30 months for some higher price ranges. Chesapeake generally had the highest absorption rates, while Newport News and Norfolk tended to be lower.Blended Learning
Blended Learningkatsouranisg
Ěý
This document discusses blended learning approaches at Piraeus Bank. It provides an overview of Piraeus Bank, including its growth and strategic targets. It then discusses the bank's use of blended learning, when it is applied, and how courses are developed. Key points include blending classroom and online learning to reinforce concepts, ensuring the instructor is involved in course design, and not blending just for the sake of it. The document concludes with a case study on a successful blended learning initiative to sell a complex financial product.Ub0203 IT january 2012
Ub0203 IT january 2012ayubsrd
Ěý
This document contains a sample survey of 16 individuals showing their age, gender, home ownership status, marital status, salary, and number of children. It also contains a pie chart and table summarizing the salaries of the individuals, with over half (56.25%) earning between 2000-2999 and a quarter earning 4000 or above.Ub0203 slideshare.net
Ub0203 slideshare.netayubsrd
Ěý
This document contains a sample survey of 16 individuals showing their age, gender, home ownership status, marital status, salary, and number of children. It also contains a pie chart and table summarizing the salaries of the individuals, with over half (56.25%) earning between 2000-2999 and a quarter earning 4000 or above.CUBOM Event Data Analysis
CUBOM Event Data Analysisrosey36v
Ěý
The document analyzes attendance data for various student events from fall 2008 to winter 2009, showing an overall negative trend in participation, with a calculated average slope of -2.34878. Specific events like the comedy club and live on campus saw significant declines, while the java club and special events demonstrated positive attendance trends, with special events experiencing the largest increase. This analysis aims to help committees improve attendance by sharing successful marketing strategies and addressing challenges.Deutsche EuroShop | Company Presentation | 03/10
Deutsche EuroShop | Company Presentation | 03/10Deutsche EuroShop AG
Ěý
Deutsche EuroShop is Germany's only public company that invests solely in shopping centers. It owns 17 shopping centers located primarily in Germany, but also in Poland, Austria and Hungary. Deutsche EuroShop aims to grow its net asset value over the long term through its high-quality portfolio of shopping centers that have occupancy rates over 99% and lease terms of over 7 years on average.Case Study_ MARKET PENETRATION OF WIRELES COMMUNICATION IN RURAL AREAS
Case Study_ MARKET PENETRATION OF WIRELES COMMUNICATION IN RURAL AREASabhishek.2105
Ěý
The case study by Abhishek Tewari examines market penetration of wireless communication in rural India, highlighting the significant rural population and its contribution to the economy. It identifies challenges for marketers, such as low purchasing power and geographic dispersion, while also noting improvements in income and literacy that present growth opportunities. The research indicates that rural consumers prefer affordable mobile phones, driving a shift toward wireless communication as the market continues to expand.Copy Of Consumer
Copy Of ConsumerPaul Bujak
Ěý
This document contains household income, size, and amount charged data for 50 households. It includes summary statistics for the variables. There is a high positive correlation (R=0.75) between household income and amount charged, with income explaining 57% of the variation in amounts charged. A regression model found that for every $1,000 increase in household income, the amount charged increases by $40.48 on average, after controlling for an intercept of $2,204.Engagement Metrics May 2012
Engagement Metrics May 2012Absolute Radio
Ěý
The document contains data on app installs, usage, registrations, and online activity for Absolute Radio Network from 2009 to 2012. It shows:
1) App installs grew significantly from 2009 to 2012, especially for Android and iPhone.
2) App active users and sessions peaked in late 2011 and early 2012 before declining slightly.
3) Total account registrations, including mobile and desktop, increased steadily throughout the period shown.
4) YouTube video views and engagement in terms of likes, comments, and shares also increased over time.Data-driven teacher effectiveness: Where to begin?
Data-driven teacher effectiveness: Where to begin?Catapult Learning
Ěý
Growth modeling uses assessment data schools already have to compare student growth percentiles between teachers and identify best practices. It allows schools to focus support on struggling learners and replicate effective teachers without additional testing or costs. The approach identifies outliers, inquires into factors driving performance, and supports sharing best practices.Deutsche EuroShop | Company Presentation | 01/12
Deutsche EuroShop | Company Presentation | 01/12Deutsche EuroShop AG
Ěý
This document provides an overview of Deutsche EuroShop, a German company that invests solely in shopping centers. It owns 19 shopping centers across Germany, Poland, Austria and Hungary, with a total lettable space of around 899,000 square meters. The company aims for long-term growth and stable increases in portfolio value. Key figures include annual revenue over €120 million in recent years, funds from operations per share growing 10% annually, and a net asset value per share of over €26.Ad
14 feb mis
- 1. Last quarter sales '000' 25 20 y = 0.175x + 1.632 R² = 0.468 15 Last quarter sales '000' Linear (Last quarter sales '000') 10 5 0 0 10 20 30 40 50 60 70 80 90 100
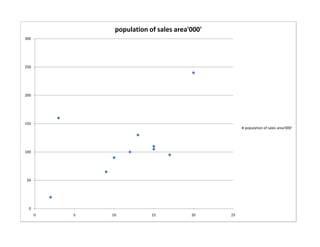
- 2. population of sales area'000' 300 250 200 150 population of sales area'000' 100 50 0 0 5 10 15 20 25
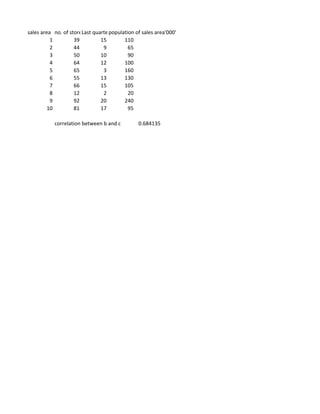
- 3. sales area no. of storeLast quarter sales '000'of sales area'000' visited population 1 39 15 110 2 44 9 65 3 50 10 90 4 64 12 100 5 65 3 160 6 55 13 130 7 66 15 105 8 12 2 20 9 92 20 240 10 81 17 95 correlation between b and c 0.684135